
Credit Card Debt is Near an All-time High
But There is No Need to Panic

At just over $1.3 trillion, credit card debt is near a record high, prompting concern that the American consumer may finally be running out of steam. But the data tell a different story. Let’s dig into the numbers.
Putting Credit Card Debt in Context
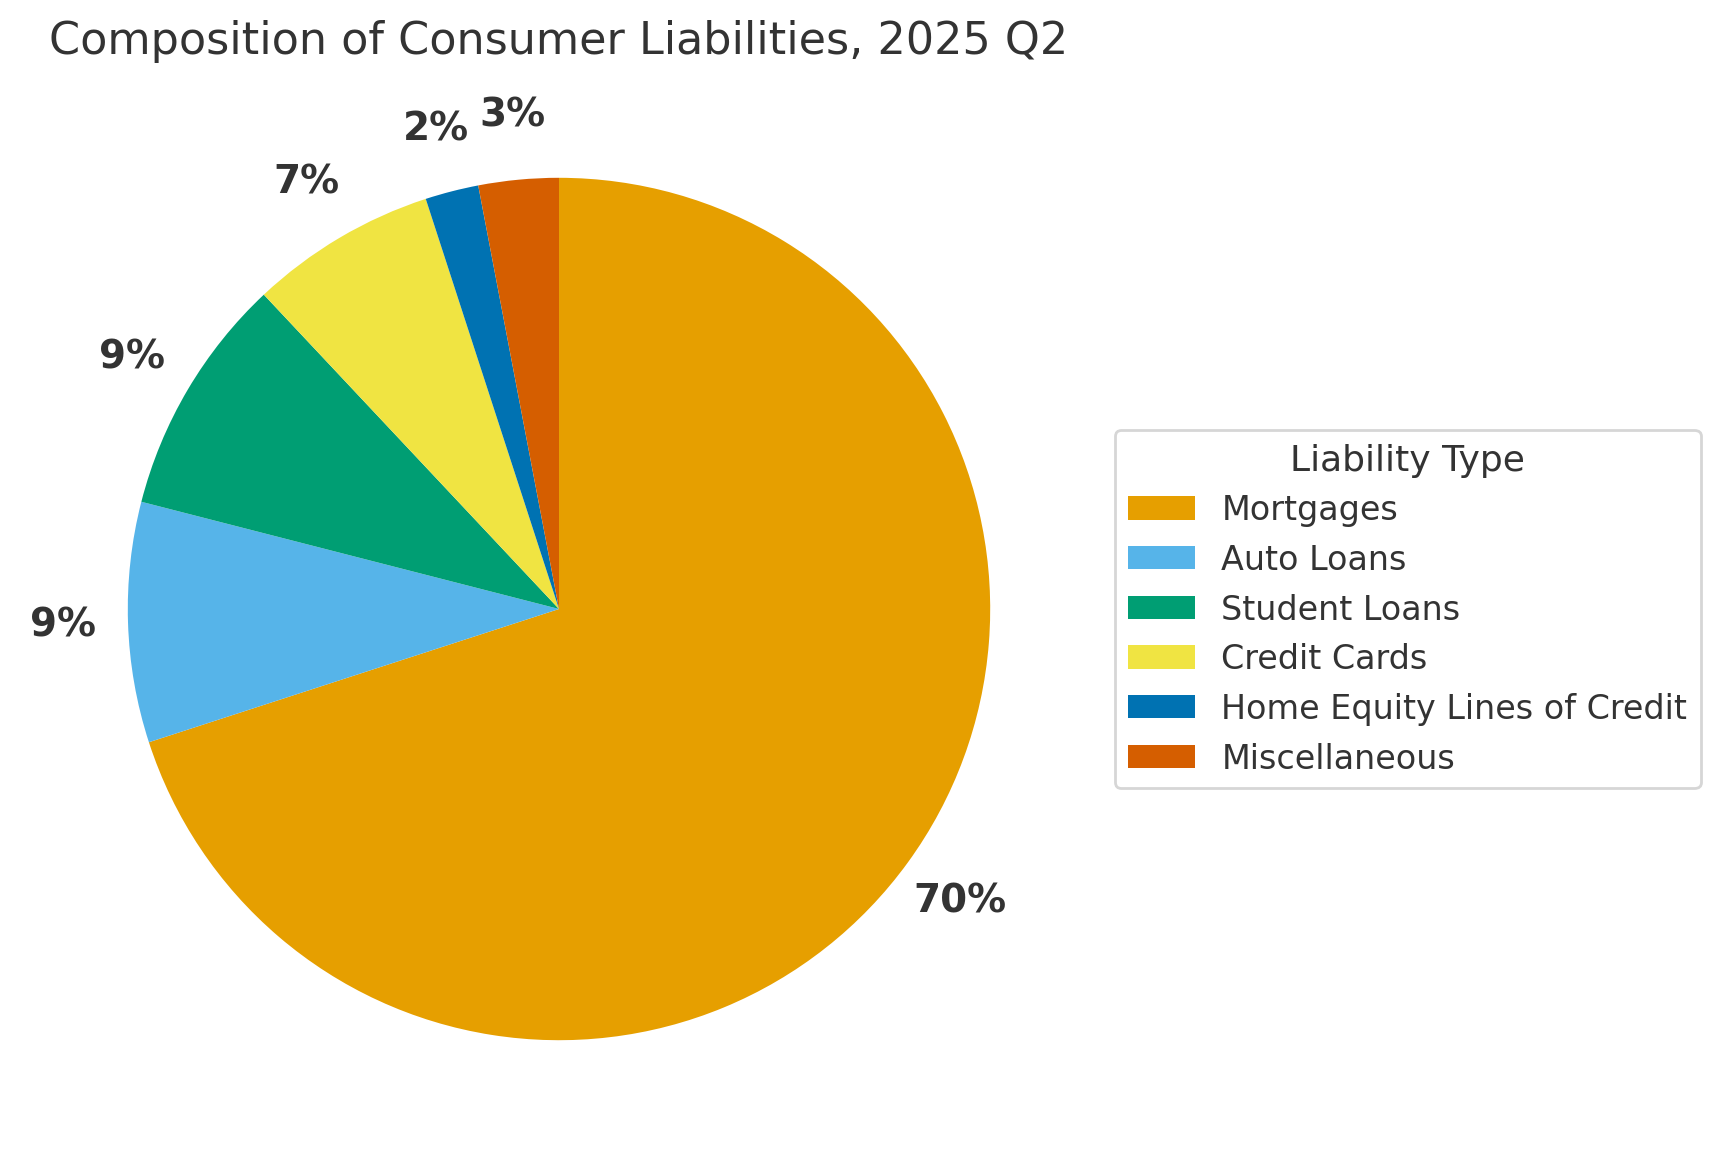
$1.3 trillion in credit card debt sounds staggering. But in the broader balance sheet of U.S. households, credit cards remain a relatively small slice. Mortgages account for about 70% of total household liabilities, auto loans and student loans each account for roughly 9%, while credit cards represent just 7% (Figure 1).
Credit card debt is, however, a useful barometer of household health because of its sensitivity to changes in economic conditions (as I have documented in my own work on the subject). When financial stress shows up, it usually shows up here first. Why? Because consumers are more likely to default on credit cards before walking away from their homes, their cars, or their student loans (which risk wage garnishment). That makes credit card debt an early-warning indicator of household financial strain.
The Post-2021 Run-Up
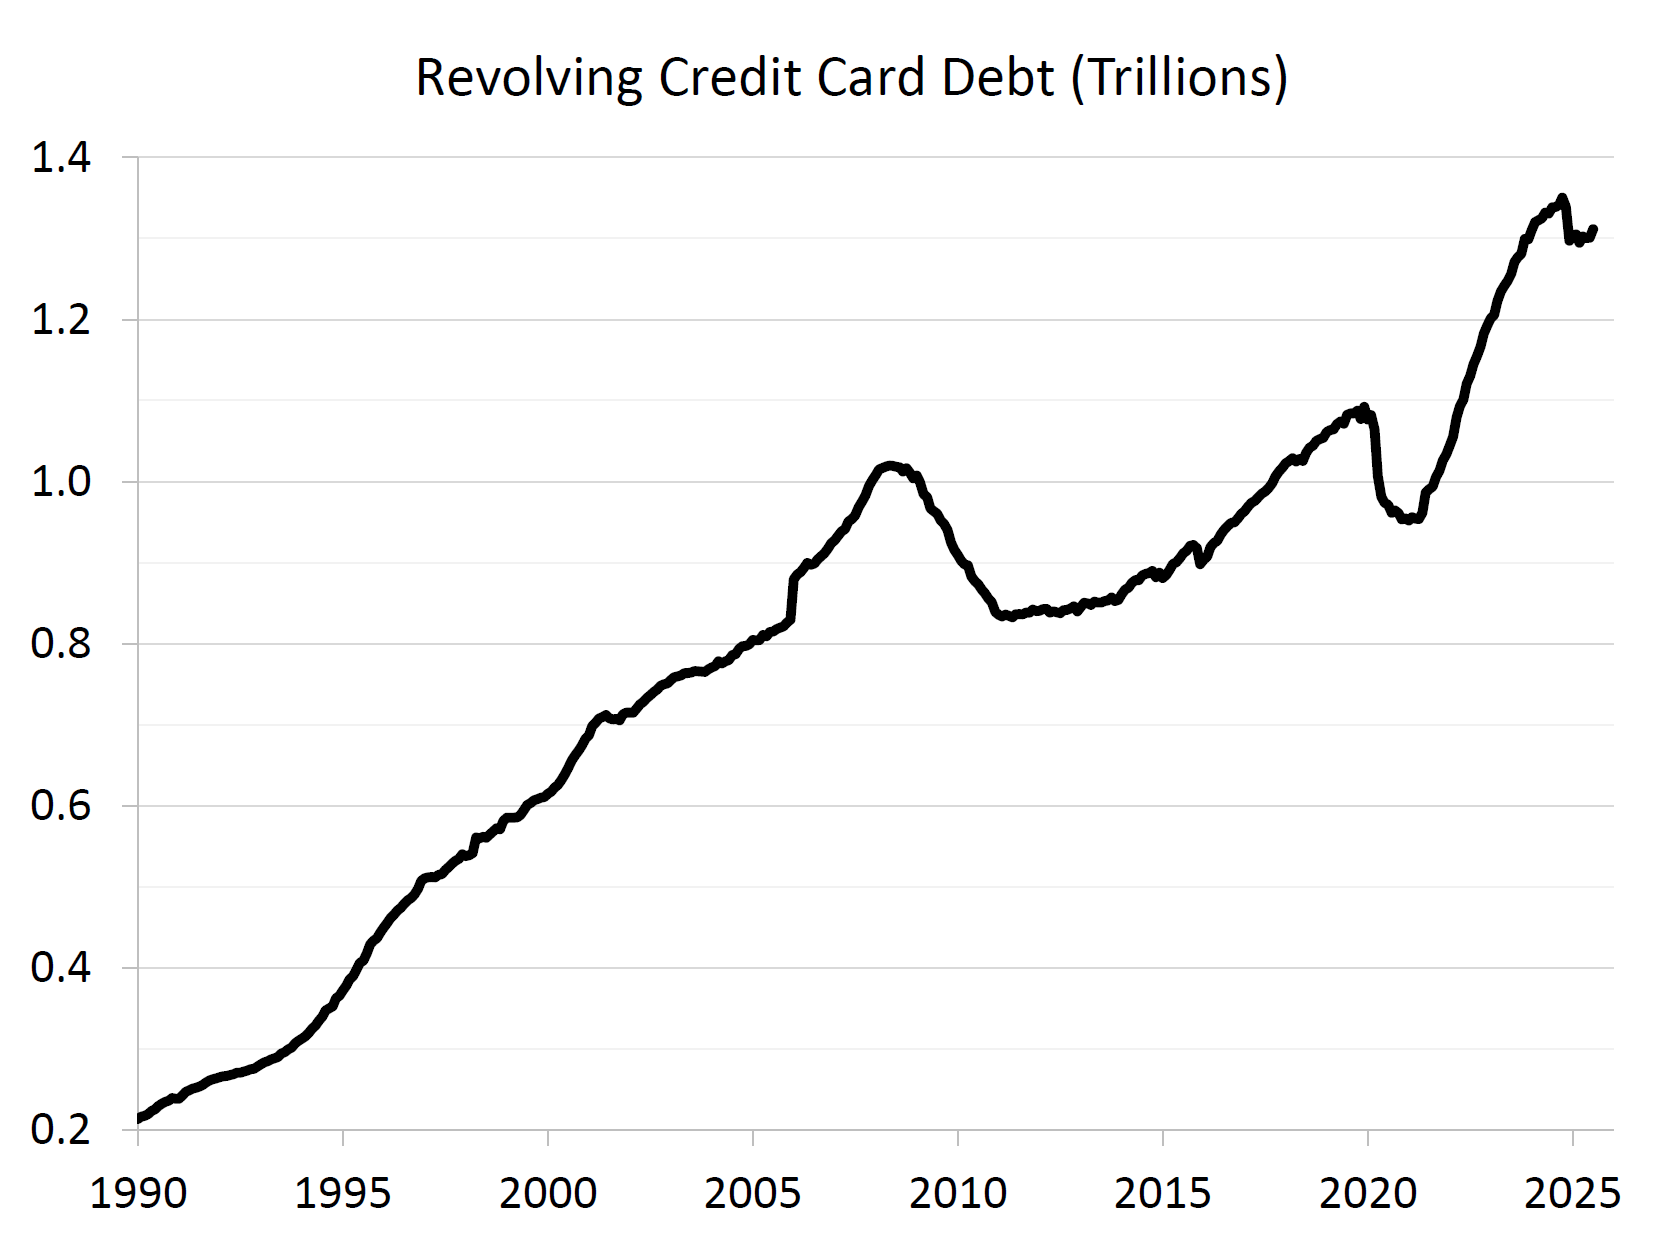
Since early 2021, revolving credit card debt is up 38% (see Figure 2). Defaults and charge-offs have also increased from their pandemic-era lows. Taken at face value, this might seem ominous.
But this framing misses a crucial point: debt levels can only be understood relative to income. This is because income determines a household’s ability to service their debt.
Debt Looks Different Relative to Income
Disposable personal income also rose sharply since 2021, keeping pace with the rise in credit card debt. As a result, the ratio of credit card debt to disposable income has barely budged since 2021. Today it sits at 0.057, a level not seen since the early 1990s outside of the Covid recession and immediate aftermath.
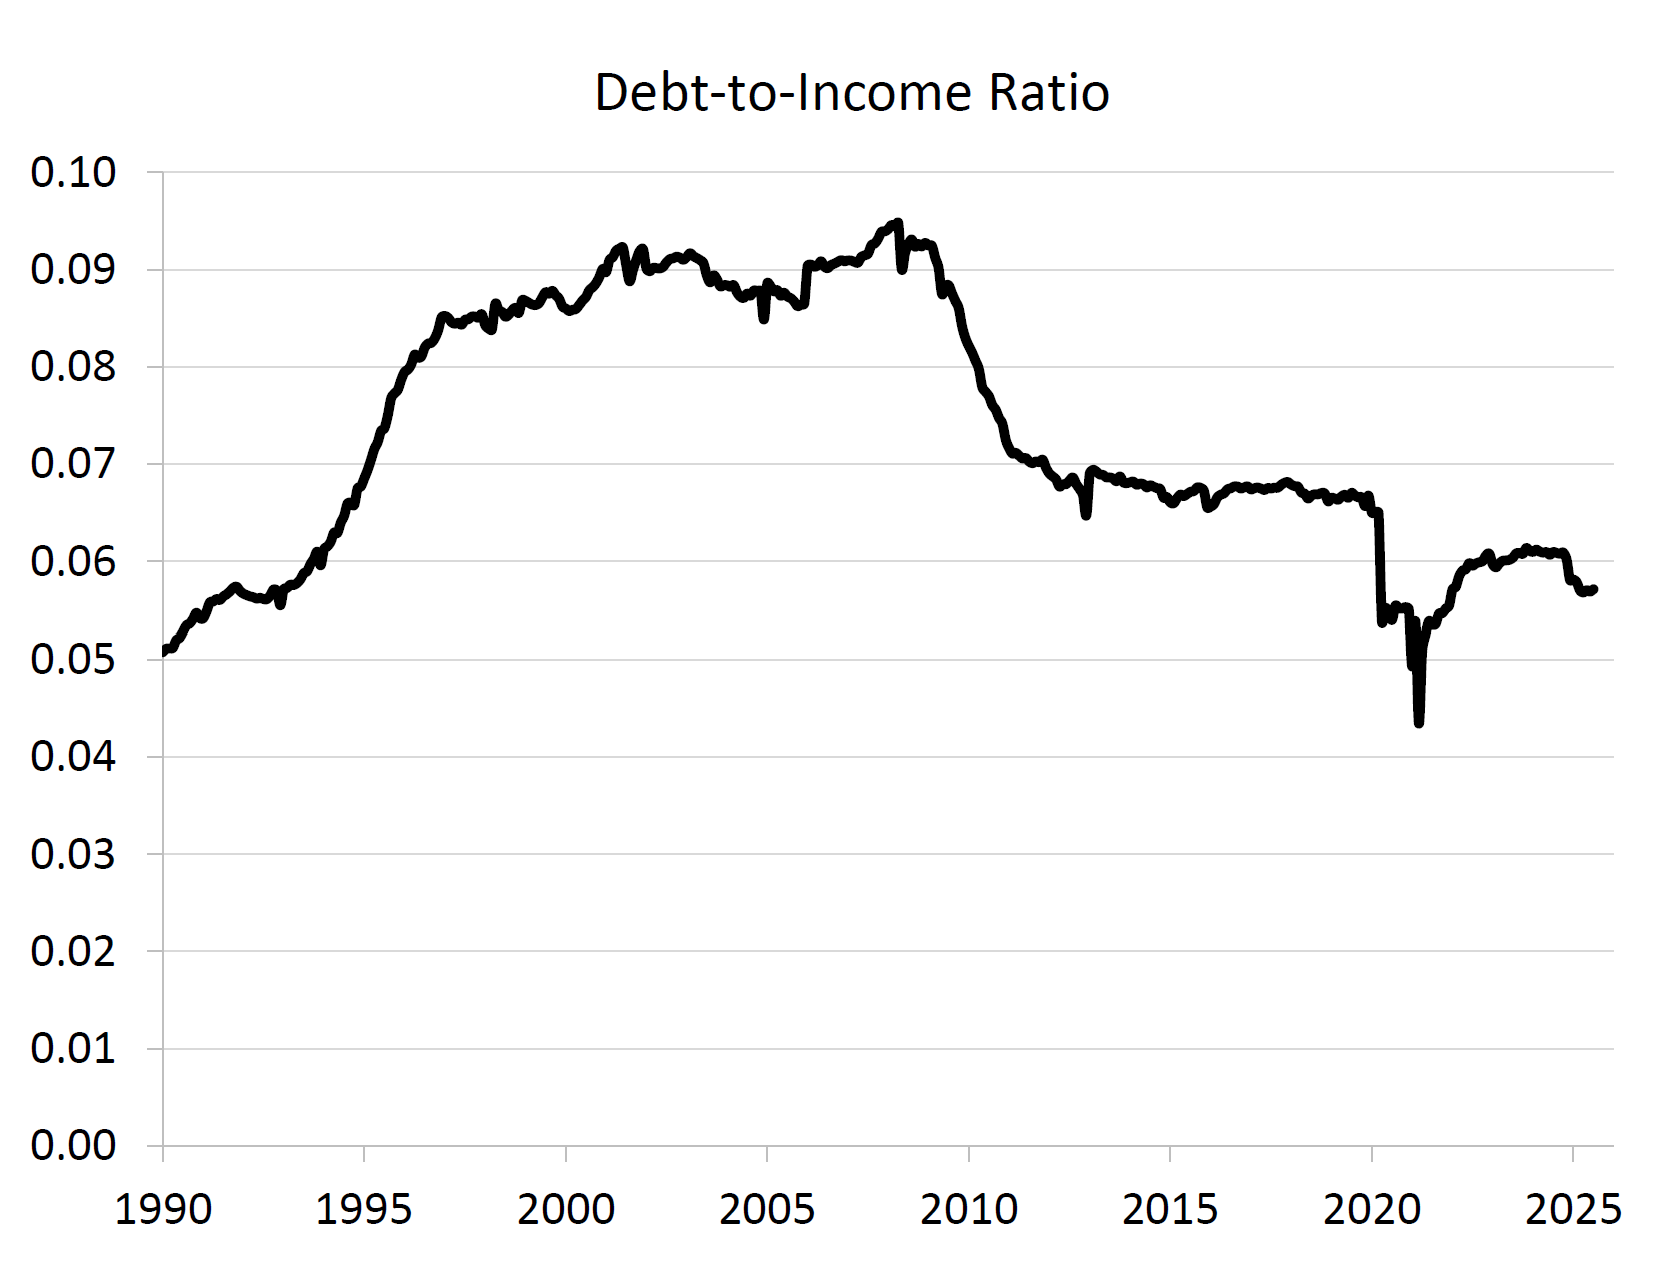
Households are indeed carrying a higher debt load, but they also have more income to service that debt. From this perspective, households are in pretty good shape.
Defaults and Charge-Offs
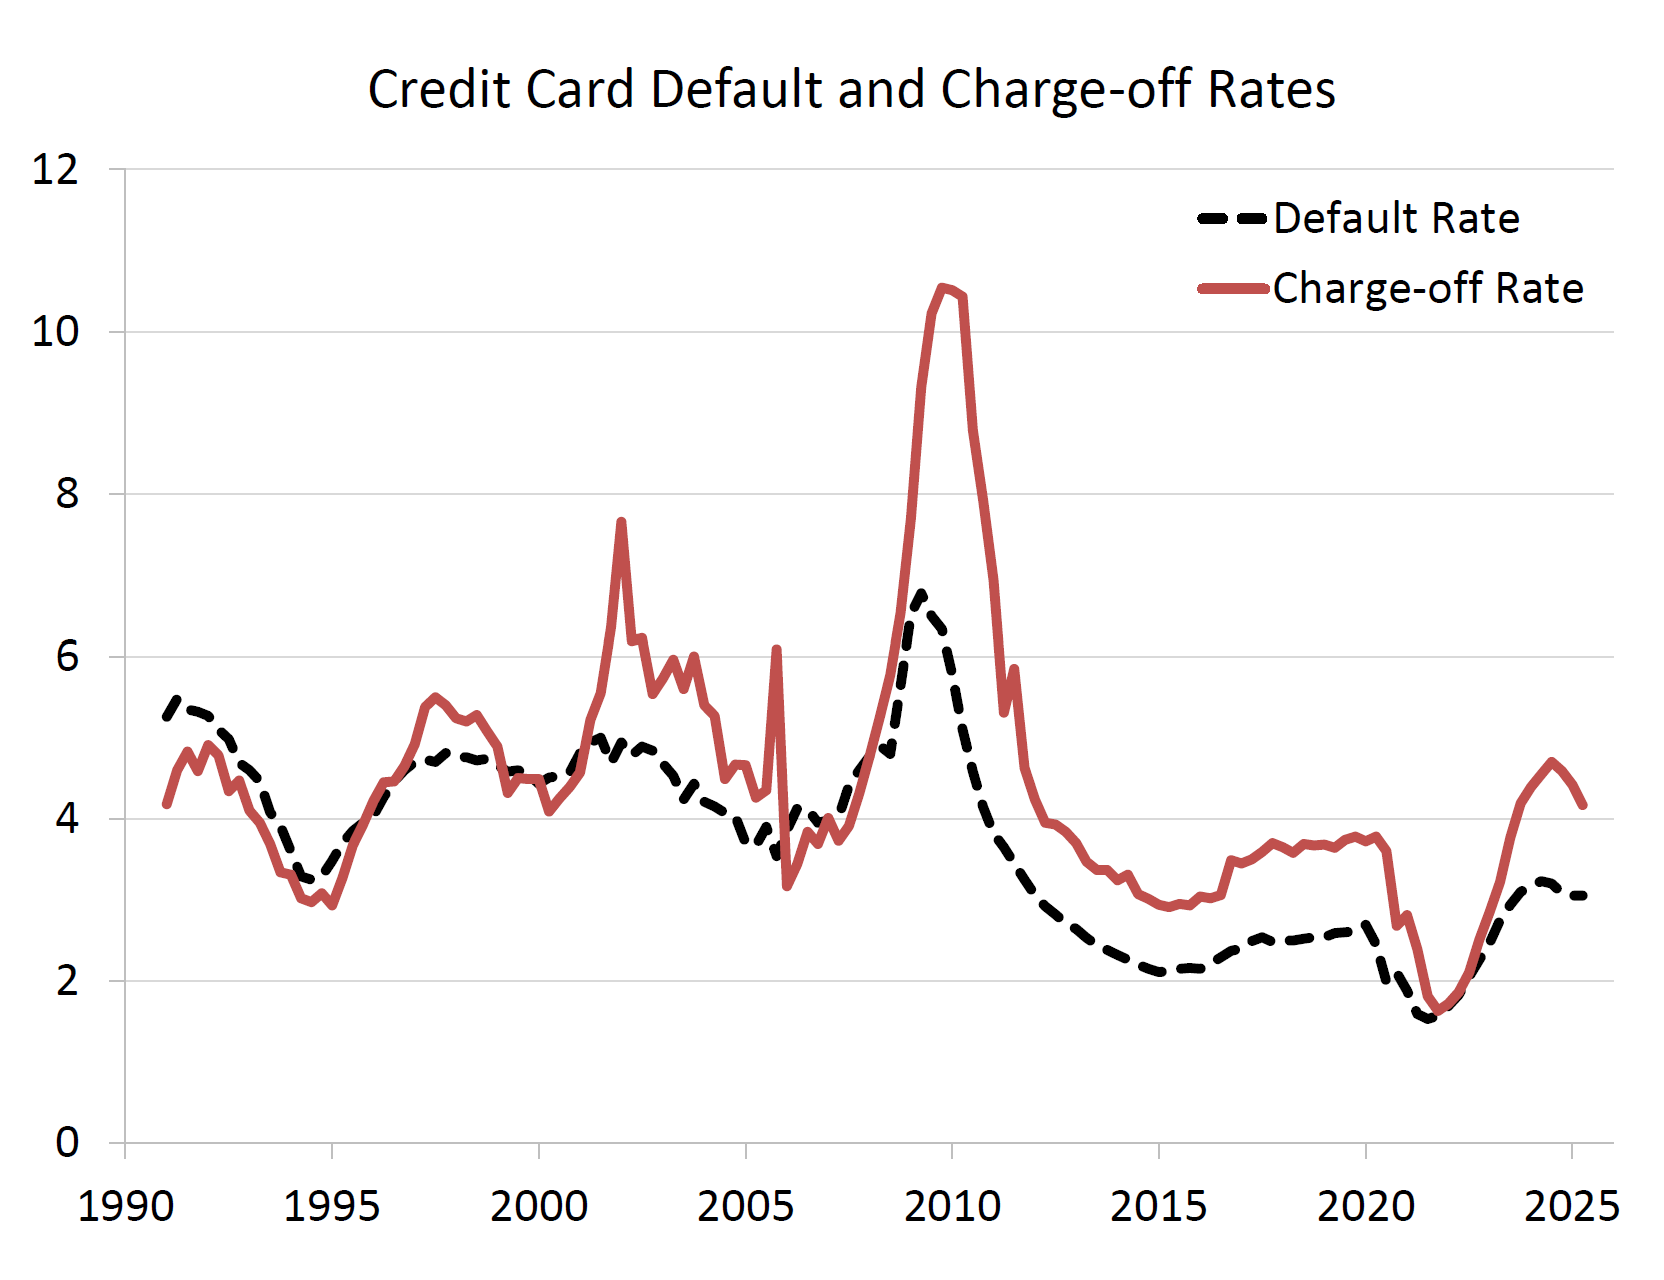
What about the stress signals? It’s also true that both default and charge-off rates have risen sharply since 2021 and are now above pre-Covid levels. But they remain far below past periods of distress. During the 2001 recession, both measures were materially higher. During the financial crisis of 2008–09, both measures spiked dramatically. By comparison, today’s levels look relatively tame. Moreover, the trend over the past six months has been generally downward.
No Reason to Panic
Put together, the data tell a far less worrying story than the headlines suggest:
Credit card balances have risen sharply since 2021, but so has disposable income.
Credit card debt relative to income is historically low.
Default and charge-off rates are elevated compared to the ultra-low pandemic era, but well below past recessionary peaks.
The Bottom Line
Near-record credit card debt in dollar terms doesn’t mean households are financially strained. By the measures that matter, like debt relative to income and the trajectory of defaults and charge-off rates, households look to be in solid shape.
Notes and Sources
AI tools were used to help transform raw data into figures and to edit prose; all calculations are straightforward to reproduce from the cited sources.
If you enjoyed this mildly efficient and occasionally rational take on credit card debt and the financial health of U.S. households, consider subscribing below. We’ll continue exploring markets and models, revealing mildly surprising truths.
No hot takes; just thoughtful ones.

About the Author: Seth Neumuller is an Associate Professor of Economics at Wellesley College where he teaches and conducts research in macroeconomics and finance. He holds a Ph.D. in economics from UCLA. His Substack is Mildly Efficient (and Occasionally Rational) where he explores topics in finance and macro from first principles, cutting through complexity with clear, grounded analysis.