
How Can the Stock Market Grow Faster than the Economy?
The answer is simple: shareholder yield is the wedge that lets real returns exceed real GDP growth

On a recent episode of the Animal Spirits podcast, Ben Carlson and Michael Batnick raised a question that stuck with me: how can the stock market, over long horizons, deliver returns that outstrip real GDP growth?
To put numbers on it, the U.S. economy has grown about 3 percent per year in real terms over the past century, while real stock returns have been roughly 6 to 7 percent. If stocks are claims on the economy, how can they consistently return twice as much as the economy grows?
This puzzle prompted me to investigate the link between financial market returns and macro growth. What I found is that the solution to this puzzle is straightforward: profits grow with the economy, on average, and firms also return cash to shareholders through dividends and net buybacks. Layer this shareholder yield on top of real profit growth and it becomes clear how an economy growing at 3 percent can coexist with 6 to 7 percent equity returns over the long run.
Let’s walk through the details to see how it all fits together.
Start with the income approach to computing GDP
According to the income approach, GDP is the sum of wages, profits, rent, and interest. For investors, the profit slice matters most. If corporate profits are a stable share of GDP, then profits scale one-for-one with the economy. As the economy grows, so do the profits earned by firms.
From profits to earnings per share
Not all profits belong to the public. Only a fraction shows up in publicly listed firms. And even within listed firms, profits are divided across millions of shares.
So earnings per share (EPS) for the overall stock market depend on the size of the economy, the profit share of the economy, the public share of those profits, and how many shares are outstanding.
In theory, if the profit share of the economy, the public share of profits, and shares outstanding are stable, real EPS growth will follow real GDP growth.
In practice, if shares outstanding decline via net share repurchases, then real EPS growth will follow real GDP growth plus the average annual market-cap-weighted reduction in share count.
From earnings to returns
Returns on investment in the stock market have three main components:
1) Earnings per share (EPS) growth: real EPS growth tracks real GDP growth, plus any net reduction in share count (net buybacks).
2) Dividend yield: cash returned to shareholders divided by market value.
3) Valuation changes: the average amount investors are willing to pay for a dollar of corporate earnings.
Real return ≈ EPS growth + Dividend yield + Valuation changes
In the long run, EPS growth is equal to real GDP growth plus the net buyback yield:
Real return ≈ Real GDP growth + Buyback yield + Dividend yield + Valuation changes
If valuations remain roughly stable, then:
Real return ≈ Real GDP growth + Shareholder yield ≥ Real GDP growth
Thus, over the long run, shareholder yield (dividends + net buybacks) is what raises the real return on investment in the stock market above the real growth rate of the economy.
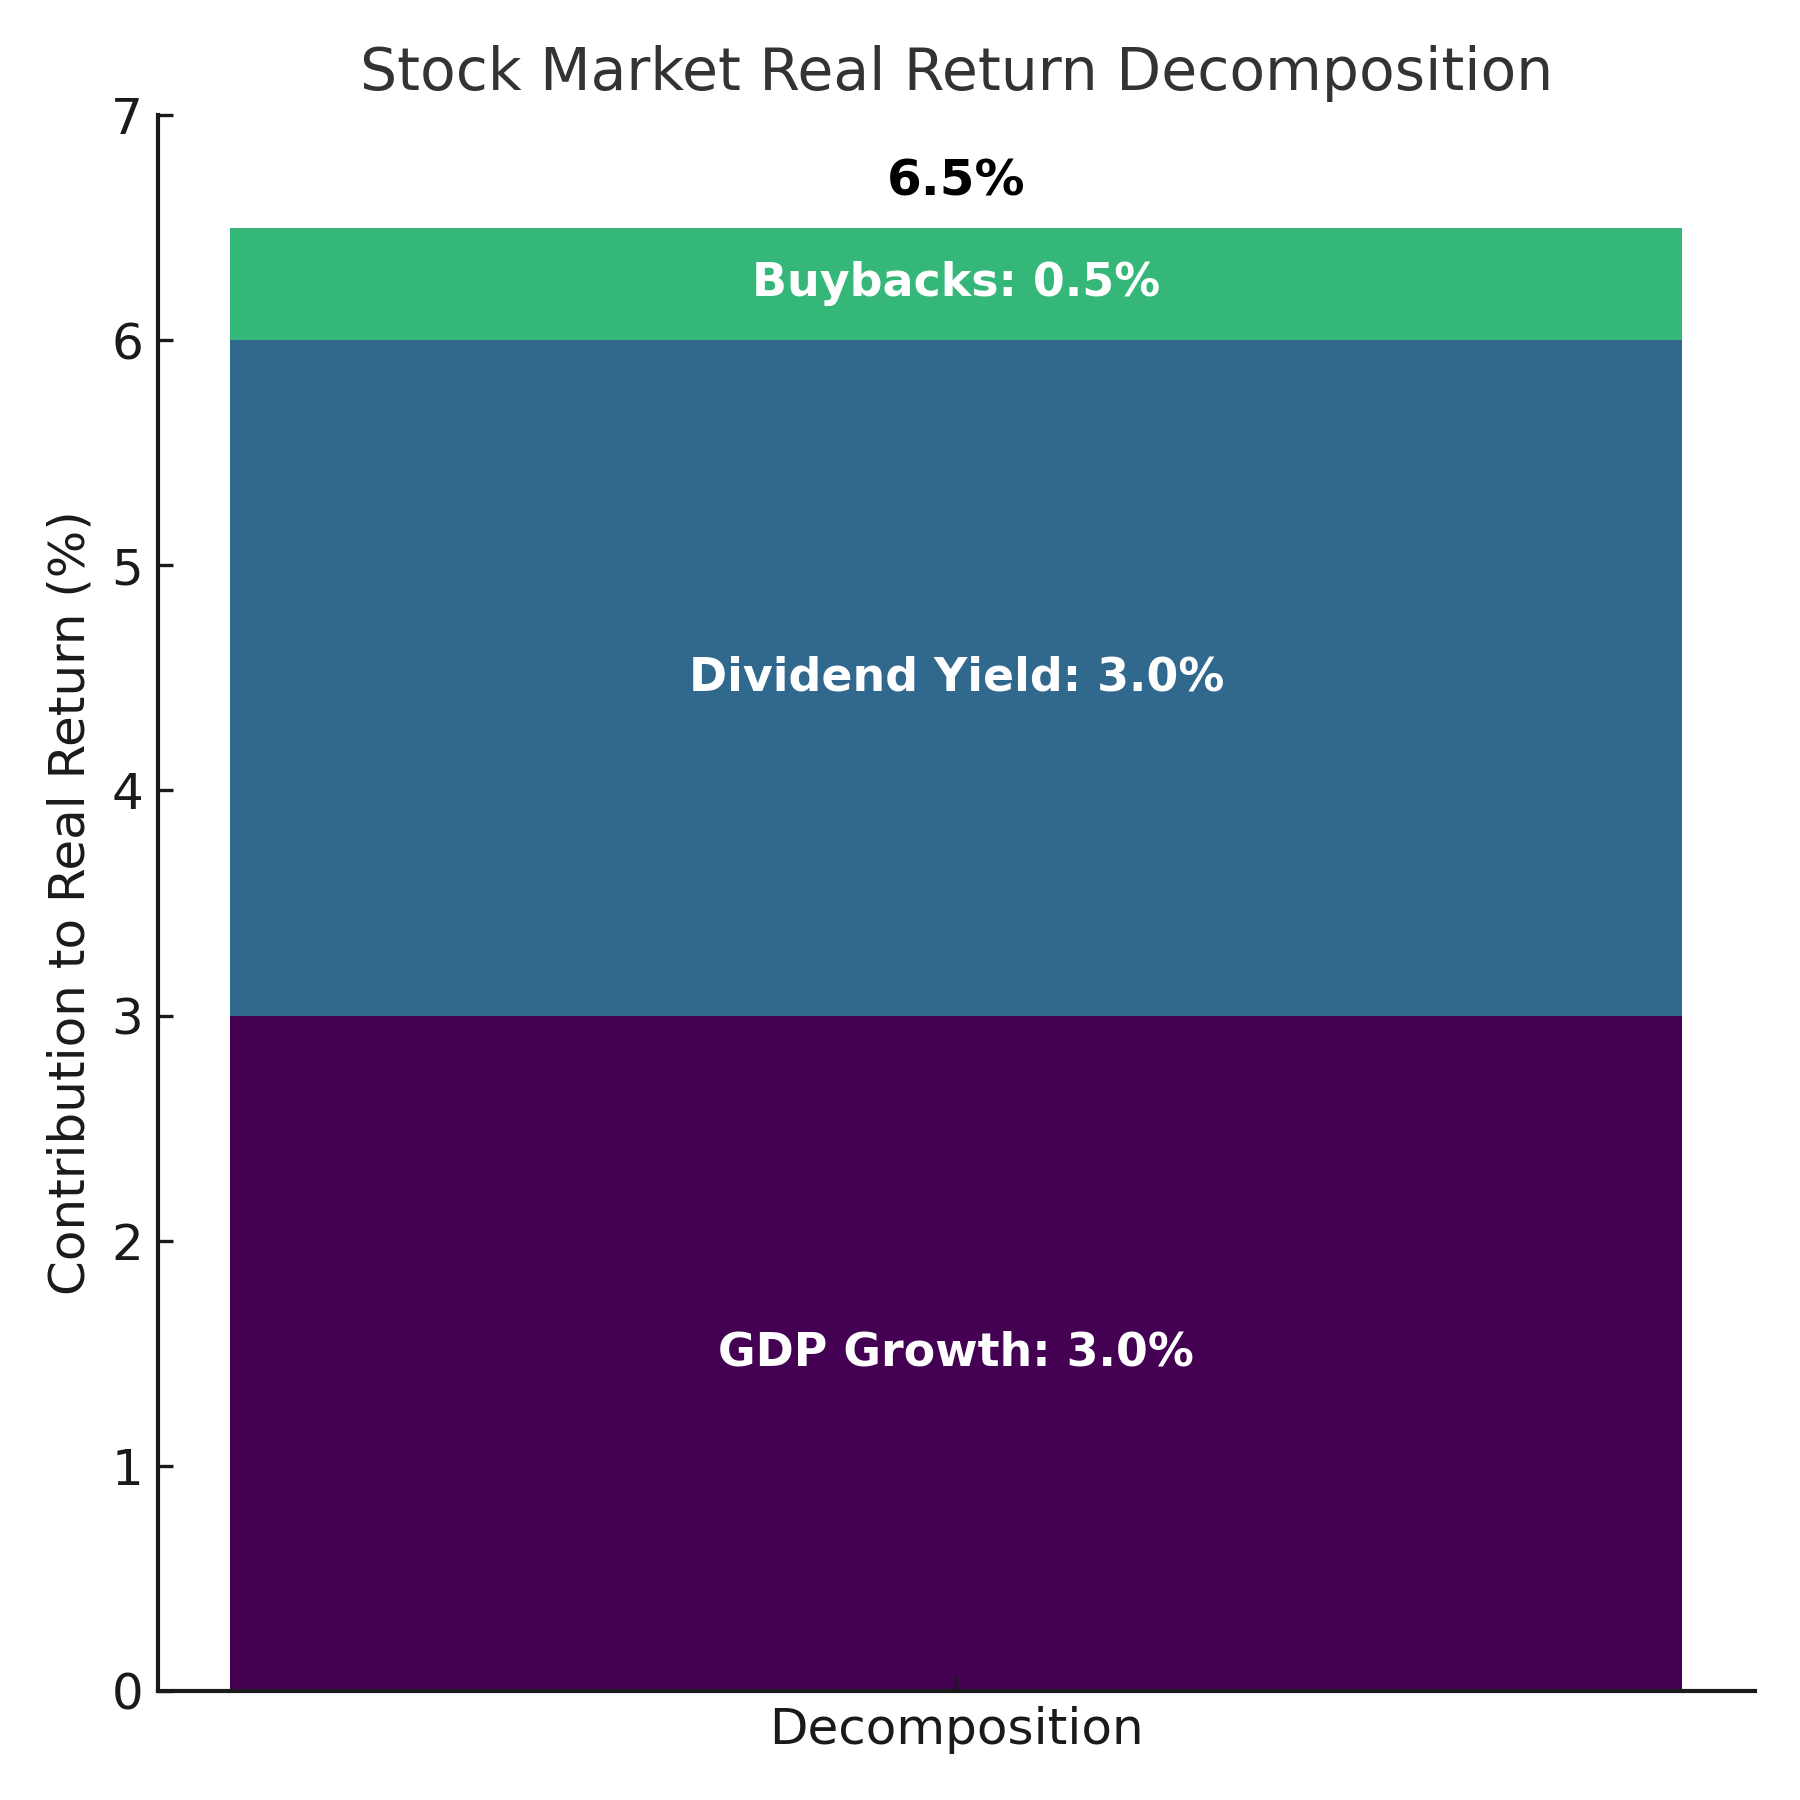
A simple numerical example
Suppose the public share of profits is constant and valuations are steady. Then the theory tells us that long-run real returns on investment in the stock market are equal to real GDP growth plus the shareholder yield.
If real GDP grows at 3 percent, the dividend yield is 3 percent, and the net buyback yield is 0.5 percent, then the theory tells us that the implied real return on investment in the stock market should be about 6.5 percent (Figure 1).
How does this theory stack up against the data?
From 1950 through 2024, real GDP in the U.S. grew at about 3.1 percent per year. Dividends averaged roughly 3.0 percent per year, and net buybacks about 0.5 percent per year, which together imply a shareholder yield of approximately 3.5 percent. Over this period, the public share of profits rose modestly by about 0.3 percent per year, while increasing valuations added another roughly 0.5 percent per year on average.
Add it together, and the theory tells us that the real return on investment in the stock market during this period should have been about 7.4 percent per year (Figure 2). The realized real return on investment in the stock market over the same window was 6.9 percent (S&P 500 with dividends reinvested, CPI deflated).
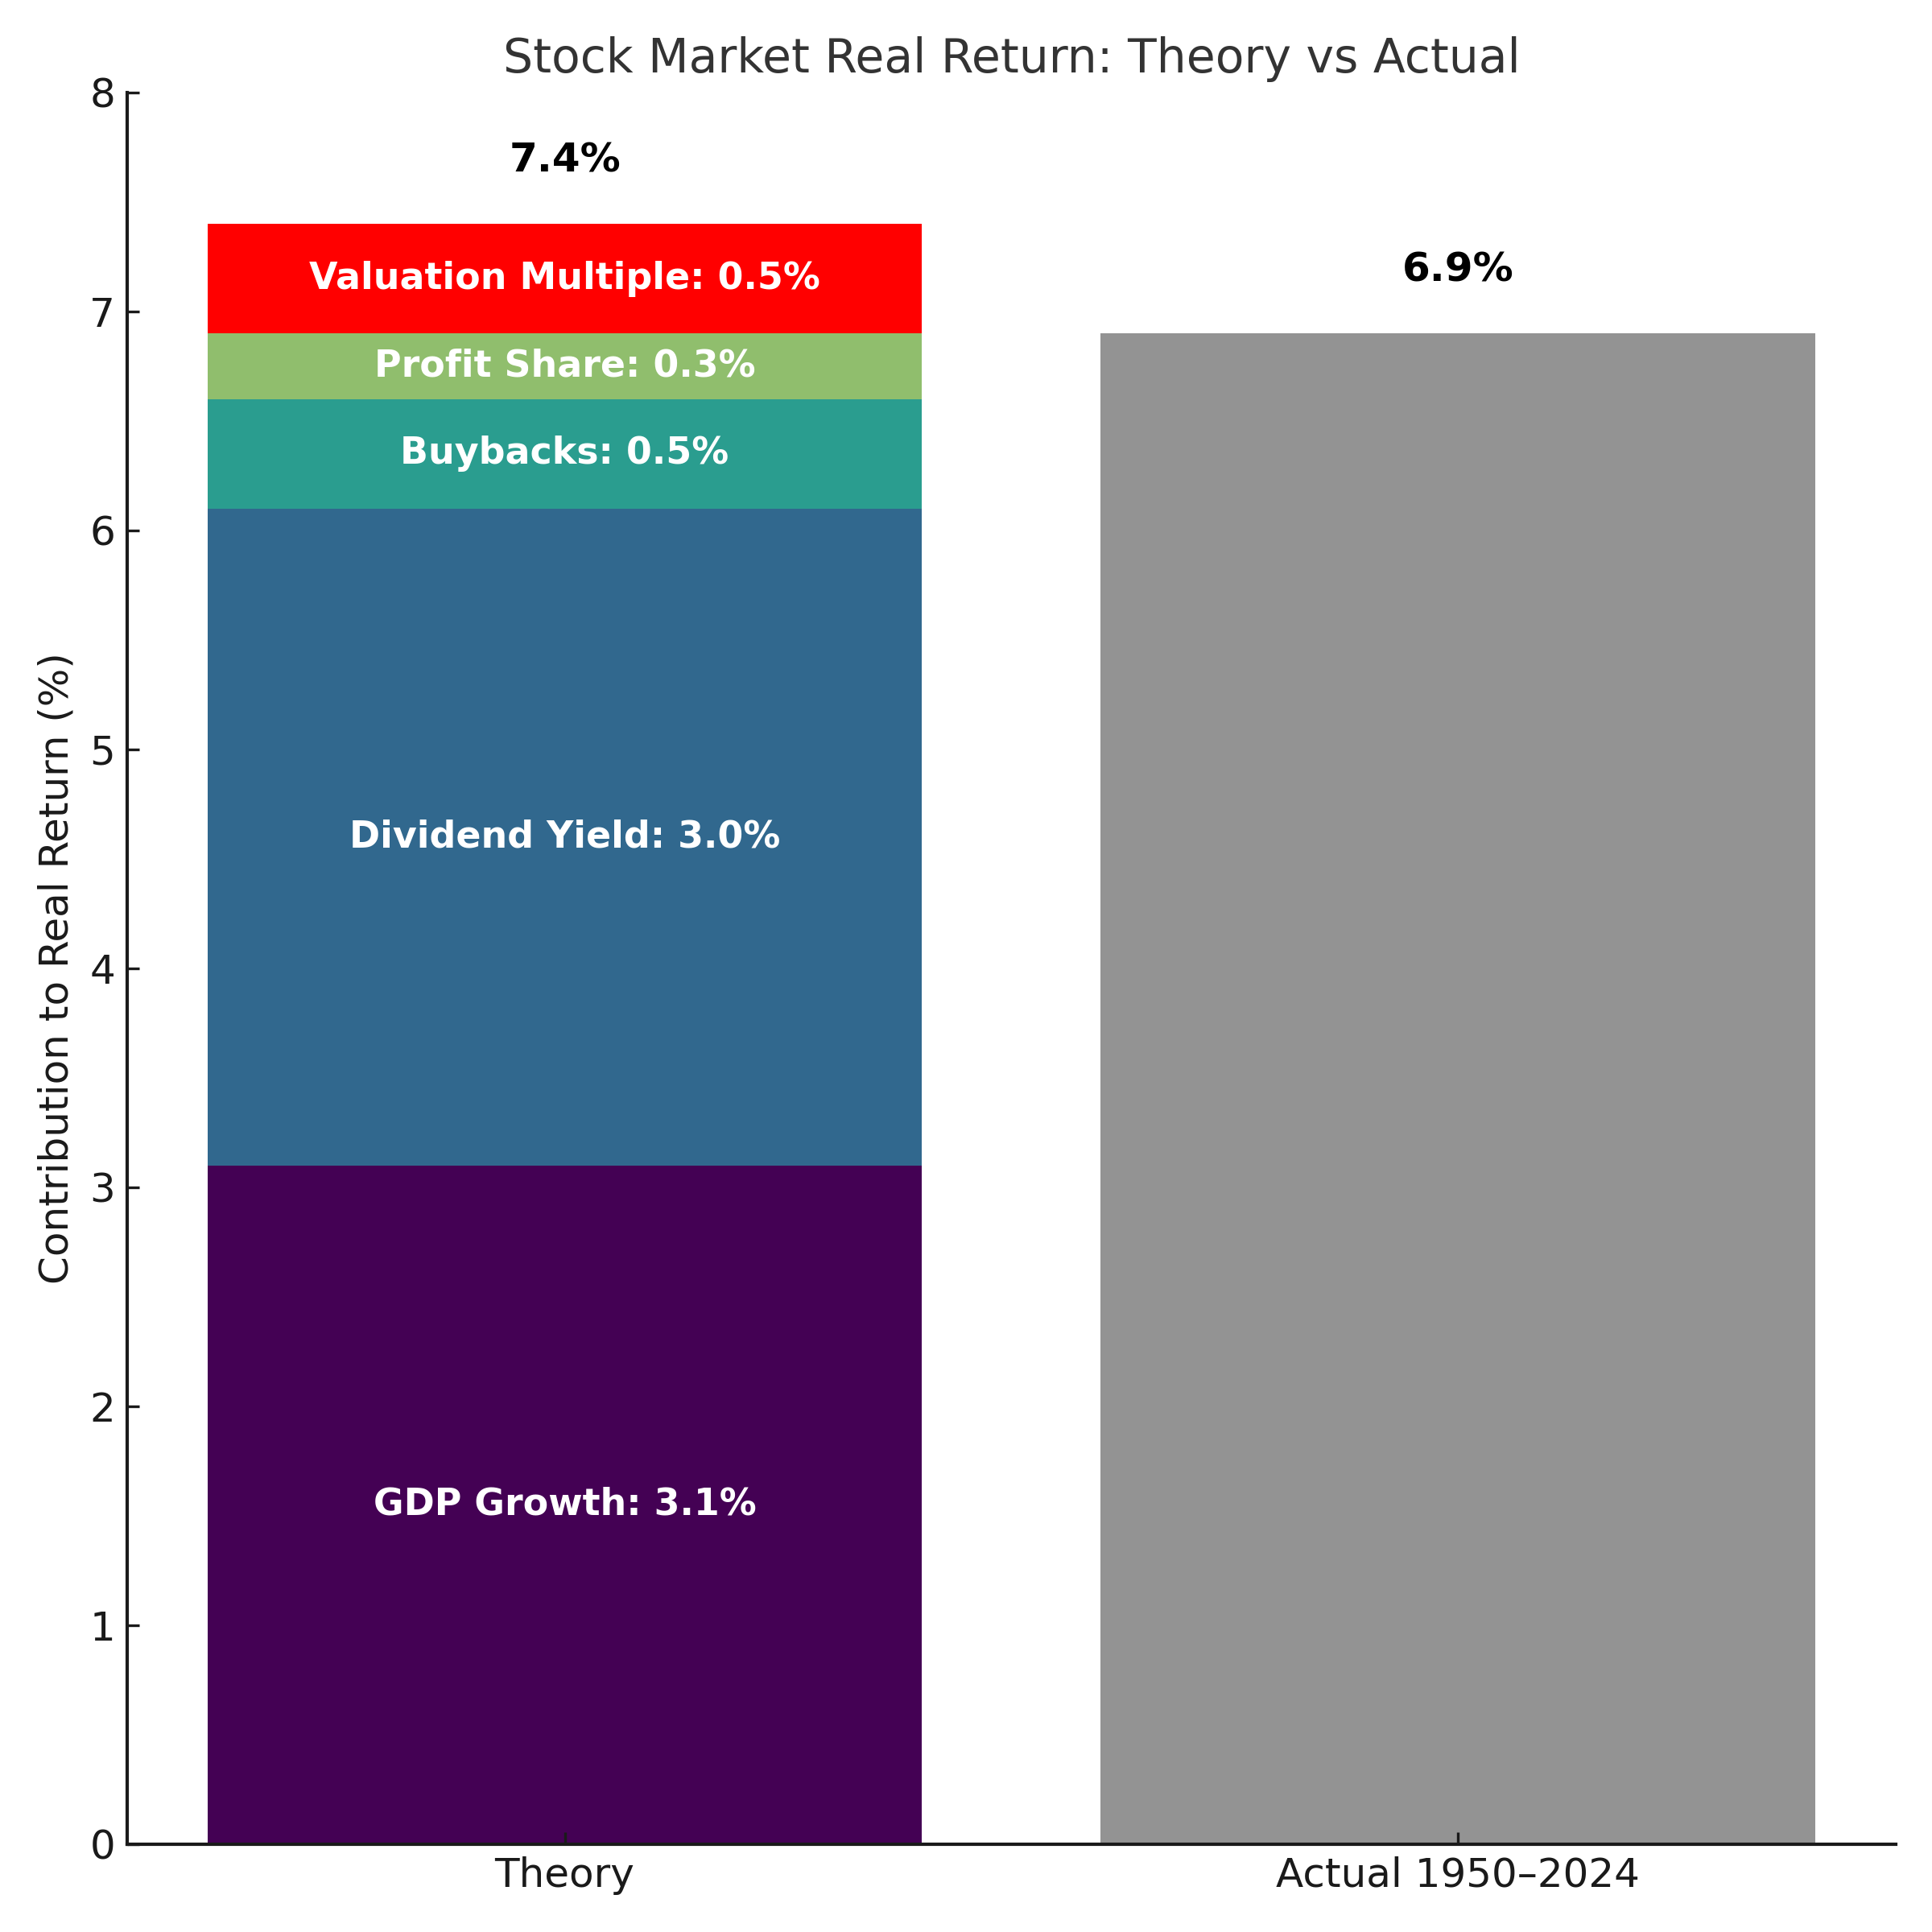
The half-percentage-point gap between theory and reality reflects measurement choices rather than economics: buyback “yield” is a dollar flow while returns depend on the net change in share count, valuation effects depend on the P/E definition and endpoints, and macro profits and public listings do not line up perfectly. Within a reasonable margin of error, the theory appears to match the data quite well.
The takeaway
The stock market, both in theory and in practice, tends to grow faster than the economy. Over the long run, real equity returns are largely determined by the sum of real GDP growth and shareholder yield, with minor adjustments for changes in the profit share of GDP and the public share of profits. While dividends used to carry most of the load of the shareholder yield, today buybacks are becoming increasingly important. Regardless, the sum of the two is what matters — shareholder yield is the wedge that lets real returns exceed real GDP growth.
For those who want the full accounting, the next section walks through all of the details.
Technical Appendix
Definitions:
GDP: real gross domestic product.
ψ (psi): profit share of GDP earned as corporate profits.
φ (phi): public share of corporate profits earned by listed firms.
Shares: total shares outstanding.
Dividend yield: cash dividends over market value.
Net buyback yield: net share repurchases over market value, net of issuance for compensation and M&A (negative when share count rises).
Shareholder yield: dividend yield + net buyback yield.
Valuation multiple: price-to-earnings ratio (TTM).
Aggregate earnings captured by publicly listed firms:
(1) E = ψ × φ × GDP
Taking logs and differentiating:
(2) g_E = g_GDP + g_ψ + g_φ
where g_X denotes the real growth rate of X.
Returns decomposition:
(3) Real return ≈ g_EPS + Dividend yield + g_Valuation
where g_Valuation is the contribution from changes in the valuation multiple (i.e. the log change in P/E).
Earnings per share (EPS):
(4) EPS = E / Shares
Taking logs and differentiating:
(5) g_EPS = g_E – g_Shares
where g_Shares is the growth rate of share count (positive when shares increase, negative when they shrink).
Substitution into returns:
(6) Real return ≈ g_E – g_Shares + Dividend yield + g_Valuation
Since –g_Shares is equivalent to the net buyback yield, combining with dividends gives total shareholder yield:
(7) Real return ≈ g_E + Shareholder yield + g_Valuation
Substituting aggregate earnings growth from (2):
(8) Real return ≈ g_GDP + g_ψ + g_φ + Shareholder yield + g_Valuation
Long-run steady state:
If profit shares (ψ) and public shares (φ) are constant, and valuations are stable, then:
(9) Real return ≈ g_GDP + Shareholder yield
Conclusion:
Over long horizons, the real return on equities will exceed real GDP growth by the shareholder yield — which has averaged about 3.5 percent during the post‑WWII period.
Notes and Sources
Real equity returns and real GDP growth are measured in real terms using CPI as the primary deflator; results are similar with PCE. Realized equity returns refer to the S&P 500 total return with dividends reinvested, deflated by CPI, using Robert Shiller’s publicly available dataset (monthly prices, dividends, earnings, and CPI). The 1950–2024 realized real return cited here is the compound annual rate over that window. Shareholder yield is defined as dividends plus net buybacks; buybacks are measured net of issuance for compensation and M&A so that the metric aligns with changes in share count. EPS growth is based on aggregate earnings captured by publicly listed firms divided by shares outstanding. The valuation term reflects the log change in the trailing twelve-month price-to-earnings multiple. Minor differences can arise from start and end dates, deflator choice, and treatment of corporate actions; none of these alter the main conclusions. AI tools were used to help transform raw data into figures and to edit prose; all calculations are straightforward to reproduce from the cited sources.
If you enjoyed this mildly efficient and occasionally rational explanation of how the real return on investment in the stock market can exceed the growth rate of the real economy over the long run, consider subscribing below. We’ll continue exploring markets and models, revealing mildly surprising truths. No hot takes; just thoughtful ones.

About the Author: Seth Neumuller is an Associate Professor of Economics at Wellesley College where he teaches and conducts research in macroeconomics and finance. He holds a Ph.D. in economics from UCLA. His Substack is Mildly Efficient (and Occasionally Rational) where he explores topics in finance and macro from first principles, cutting through complexity with clear, grounded analysis.