
Is U.S. Government Debt on a Sustainable Path?
Debt is near historic highs and rising. Its sustainability hinges on how economic growth, real interest rates, and fiscal deficits evolve over time.

Government debt held by the public is approaching 100 percent of GDP. Annual deficits are nearing $2 trillion, and higher interest rates are pushing up the cost of servicing that debt. Given the current fiscal situation and projections of rising debt in the years ahead, it is natural to ask whether U.S. government debt is on a sustainable trajectory, or whether we are setting the stage for problems down the road.
In this piece, I’ll first review the data on debt and deficits in the U.S. Then I’ll explain how economists think about the sustainability of government debt in general before applying this framework to the U.S. fiscal situation today. As I show below, the sustainability of U.S. government debt ultimately depends on how economic growth, real interest rates, and fiscal deficits evolve over time. Under plausible assumptions about economic growth and real interest rates, stabilizing today’s debt-to-GDP ratio would require reducing the primary deficit by roughly $325 billion per year.
Rapidly Rising Debt and Deficits
Figure 1 shows the evolution of U.S. government debt held by the public relative to the size of the economy since 1970.
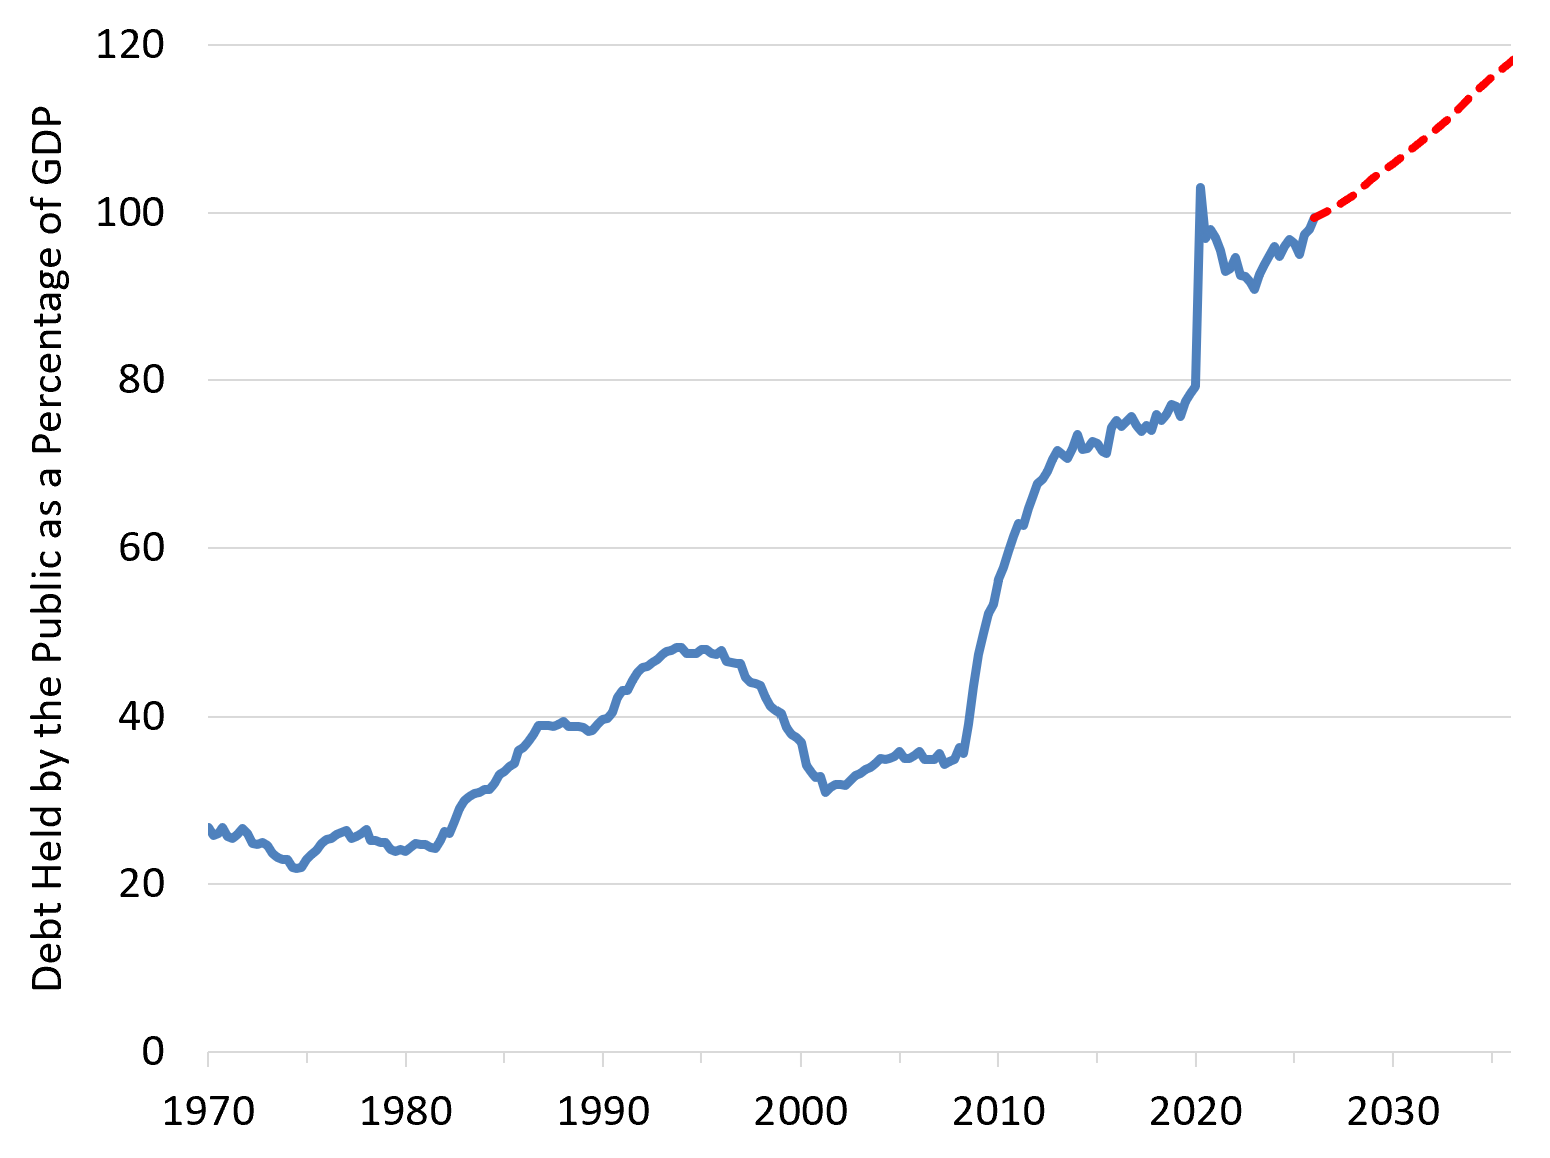
After declining during the late 1990s and early 2000s, the debt-to-GDP ratio rose sharply during the Global Financial Crisis (GFC) as collapsing tax revenues and large fiscal stimulus programs pushed deficits sharply higher. Debt shot higher again during the pandemic when emergency relief programs and the economic shutdown drove deficits to nearly 15 percent of GDP. As a result, U.S. federal debt held by the public now stands near its highest level in modern U.S. history at roughly 98 percent of GDP and is projected by the Congressional Budget Office (CBO) to reach nearly 120 percent by 2036.1
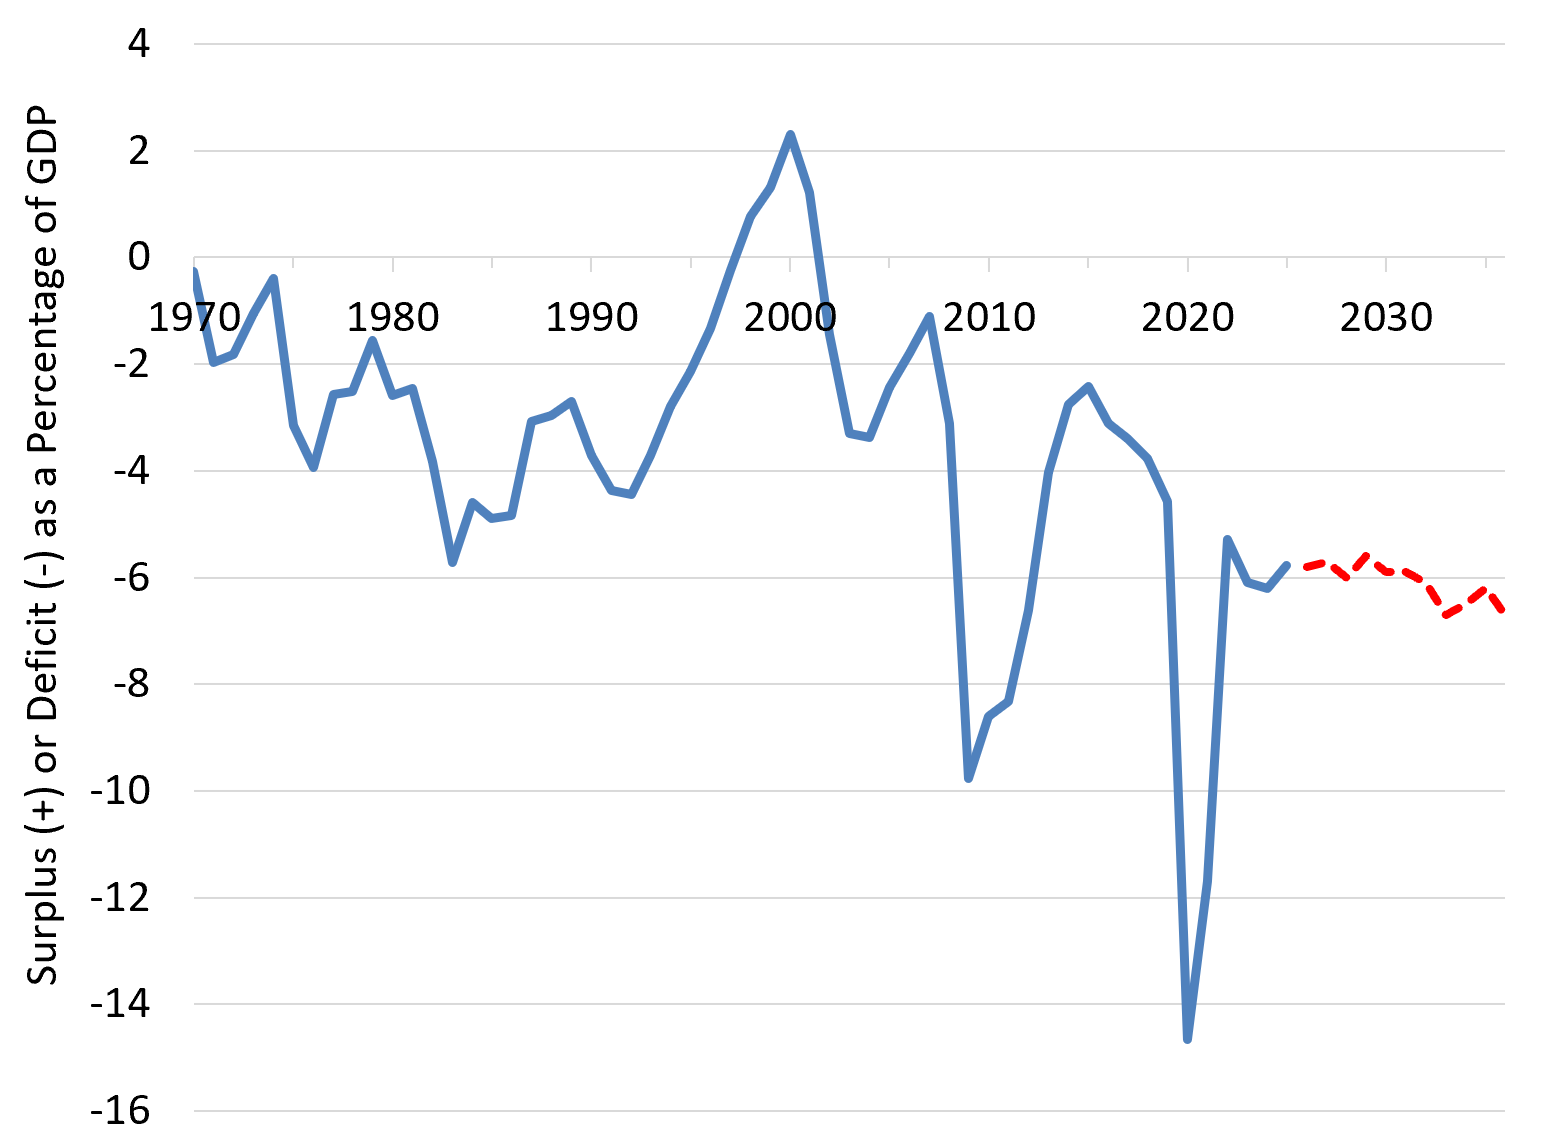
The rise in federal debt is being driven by persistent and increasing deficits. As shown in Figure 2, the federal deficit is currently running at nearly 6% of GDP. These are the largest federal deficits the U.S. has run since 1970 outside of the GFC and the COVID-19 pandemic. And there appears to be little relief in sight as the CBO expects deficits to remain at or above this level throughout the coming decade.2
What is driving these persistent deficits?
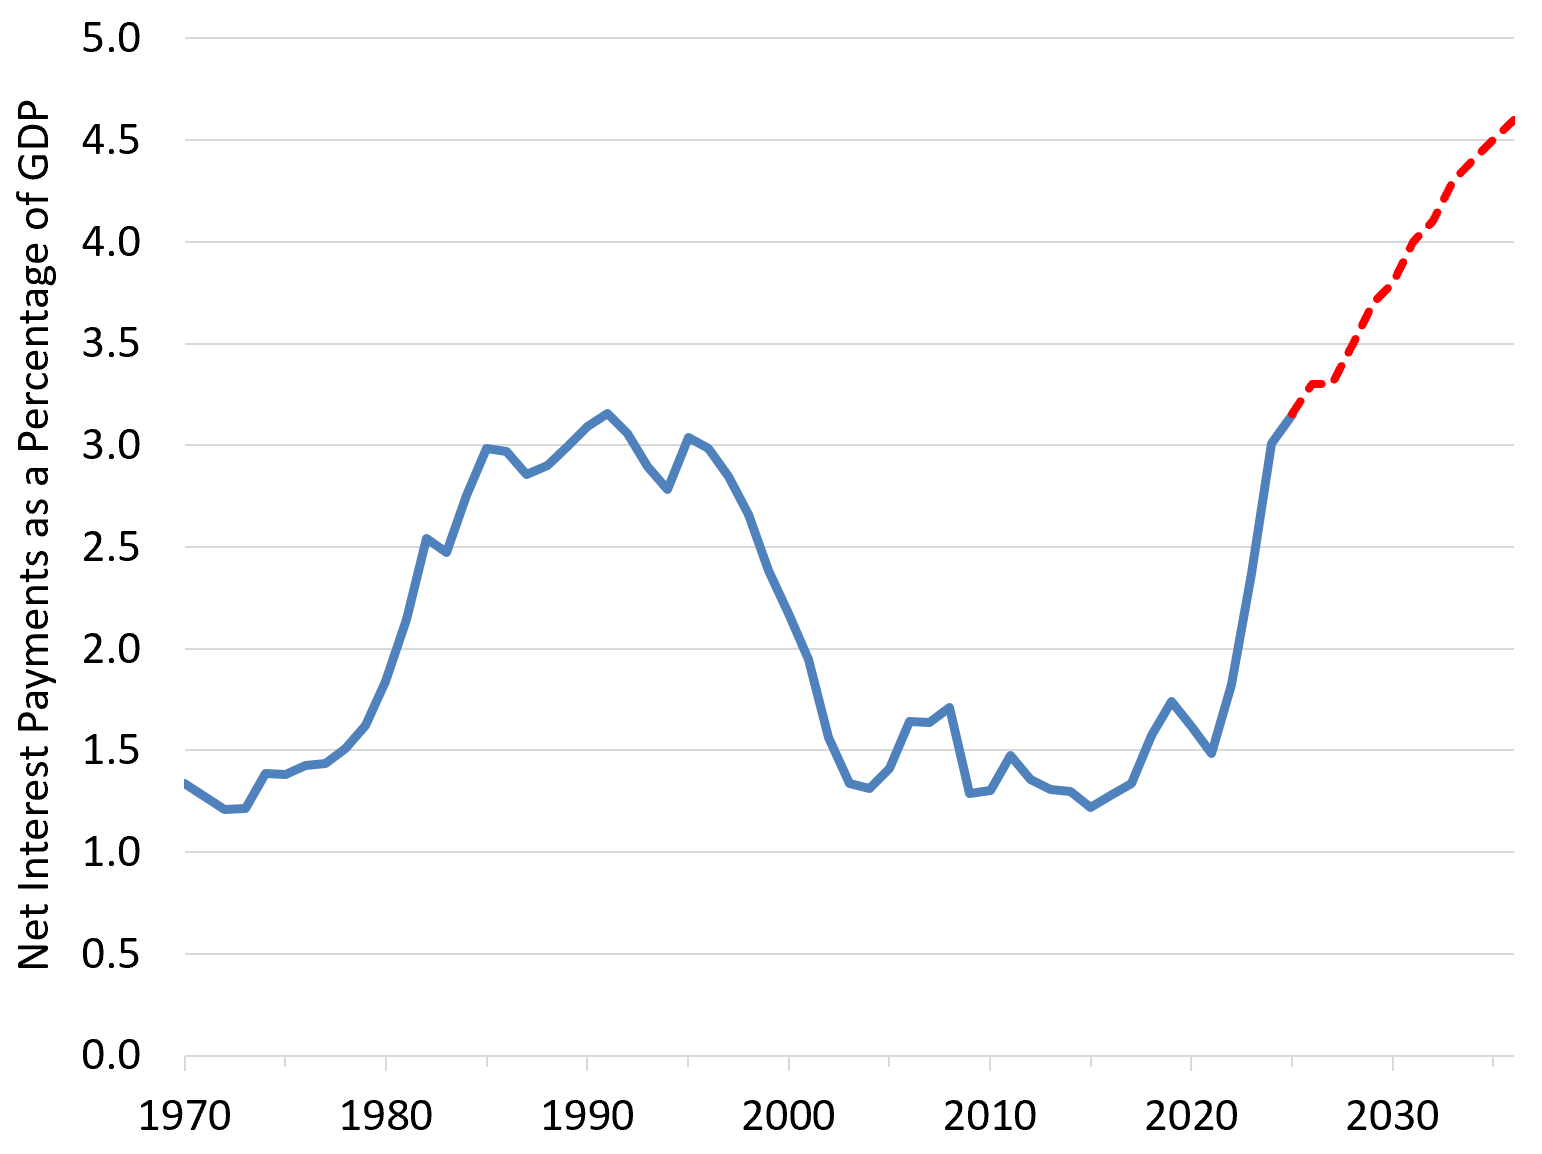
Figure 3 shows U.S. government net interest payments as a percentage of GDP since 1970. Rising debt levels combined with rising interest rates in the wake of the COVID-19 pandemic have significantly increased the total cost of servicing U.S. government debt. For much of the past decade, historically low interest rates kept federal interest payments relatively contained despite the growing stock of debt. That environment has changed. As older, low‑rate debt matures and is replaced with increased borrowing at higher rates, interest costs relative to the total size of the economy are increasing rapidly and are now at their highest levels since the mid-1990s. To put things in context, net interest payments of 3.2 percent of GDP now represent more than half of the total federal deficit, which currently stands at 5.8 percent of GDP.
Debt, deficits, and interest payments are all at or near historic highs relative to the size of the economy. How could this possibly be sustainable?
To answer this question, we need a framework for thinking about the dynamics of government debt.
A Framework for Debt Dynamics
Let’s start with a basic accounting identity that describes how government debt evolves over time:
where the primary deficit is simply the federal deficit excluding interest payments on existing debt, that is, the gap between non‑interest spending and revenues:
When non-interest spending exceeds revenue, the government is running a primary deficit.
There are two important implications of Equations (1) and (2). First, the only way to keep the level of debt from rising is if the government runs a primary surplus that is equal to or greater than its interest payments. Second, and perhaps more obvious, if the government runs a primary deficit, it must borrow to finance that gap, which increases the stock of debt. For a country like the U.S., which has run primary deficits for much of recent history, Equations (1) and (2) suggest that the level of debt will likely continue to rise.
But rising debt levels do not necessarily imply an unsustainable fiscal situation. To evaluate sustainability we first need some measure of “ability to repay debt.” While GDP is not literally “income” in the way wages are for a household, it is the broadest measure of the economy’s taxable capacity. And just as high income households can afford to carry a larger debt burden than low income households, a larger economy can support a larger stock of debt because the government has a larger tax base from which it can raise revenue to service its debt.
To incorporate this idea into our framework, we simply divide Equation (1) through by the level of GDP:
Now we have terms that are close to what we want: debt, interest payments, and the primary deficit all relative to the size of the economy (almost, as there is a timing mismatch in the first term!).
After some painstaking algebra and a few reasonable approximations, we arrive at the following equation which characterizes how the debt-to-GDP ratio changes from one year to the next:3
where r is the real interest rate on government debt, g is the growth rate of real GDP, and PD/Y is the primary deficit as a share of GDP.4 Equation (4) captures the key forces that determine whether the debt-to-GDP ratio rises or falls over time, and we will use it shortly to evaluate the current outlook for U.S. government debt.
There are two implications of Equation (4) that I want to point out. First, all else constant, primary deficits push the debt-to-GDP ratio higher, while primary surpluses push it lower. Second, the real interest rate (r) and rate of real economic growth (g) play crucial roles as well. In fact, Equation (4) tells us that if the rate of real economic growth exceeds the real interest rate on government debt r, the debt-to-GDP ratio can fall even if the government is running a (modest) primary deficit.
The intuition for this result is as follows: If the economy is growing faster than the real interest rate (i.e., g > r), then the government’s “ability to repay debt” is rising faster than interest is accruing. In that environment, the government can afford to run modest primary deficits while maintaining a stable, slowly rising, or even falling debt‑to‑GDP ratio.
Conversely, if the economy is growing slower than the real interest rate (i.e., g < r), then the opposite occurs: interest on the debt compounds at a faster rate than the government’s capacity to service its debt, and the debt-to-GDP ratio will rise. That is, unless the government implements austerity measures sufficiently large to generate a primary surplus.
Now onto the Sustainability of U.S. Government Debt
We are now in a position to apply the debt dynamics framework we have developed, Equation (4) in particular, to evaluate under what conditions the U.S. government debt is on a sustainable trajectory.
To proceed, we first need estimates for g, r, and D/Y.
Over more than two centuries of U.S. data, real GDP growth has averaged roughly 3 percent per year, despite substantial fluctuations across decades. So a reasonable estimate for the long-run rate of real economic growth g is about 3 percent.
The real interest rate on government debt is determined in financial markets. If the neutral nominal policy rate is roughly 4 percent, and all indications are that this is about right in today’s environment, and inflation stabilizes near the Federal Reserve’s 2 percent target, a reasonable long‑run estimate of the real interest rate r is about 2 percent.
Together, our estimates for g and r imply a growth-interest differential of roughly 1 percentage point (that is, g − r ≈ 3% - 2% = 1%). With the rate of real economic growth greater than the real interest on government debt, the federal government can afford to run modest primary deficits and still maintain control over its outstanding debt obligation. Thus, we are in a relatively forgiving environment for debt dynamics.
The key question, however, is how large of a primary deficit can the federal government run without causing a further increase in the debt-to-GDP ratio?
Setting Δ(D/Y) equal to zero in Equation (4), the primary deficit that would leave the debt-to-GDP ratio unchanged is:
Given that the debt-to-GDP ratio for the U.S. currently stands at around 98 percent, Equation (5) implies that:
Thus, our debt dynamics framework implies that the primary deficit consistent with a stable debt-to-GDP ratio for the U.S. is about 1 percent of GDP.
How does this compare to the actual primary deficit in recent years and that projected going forward? Figure 4 plots the primary deficit-to-GDP ratio for the U.S. since 1970, along with the CBO’s projections from 2026 through 2036.
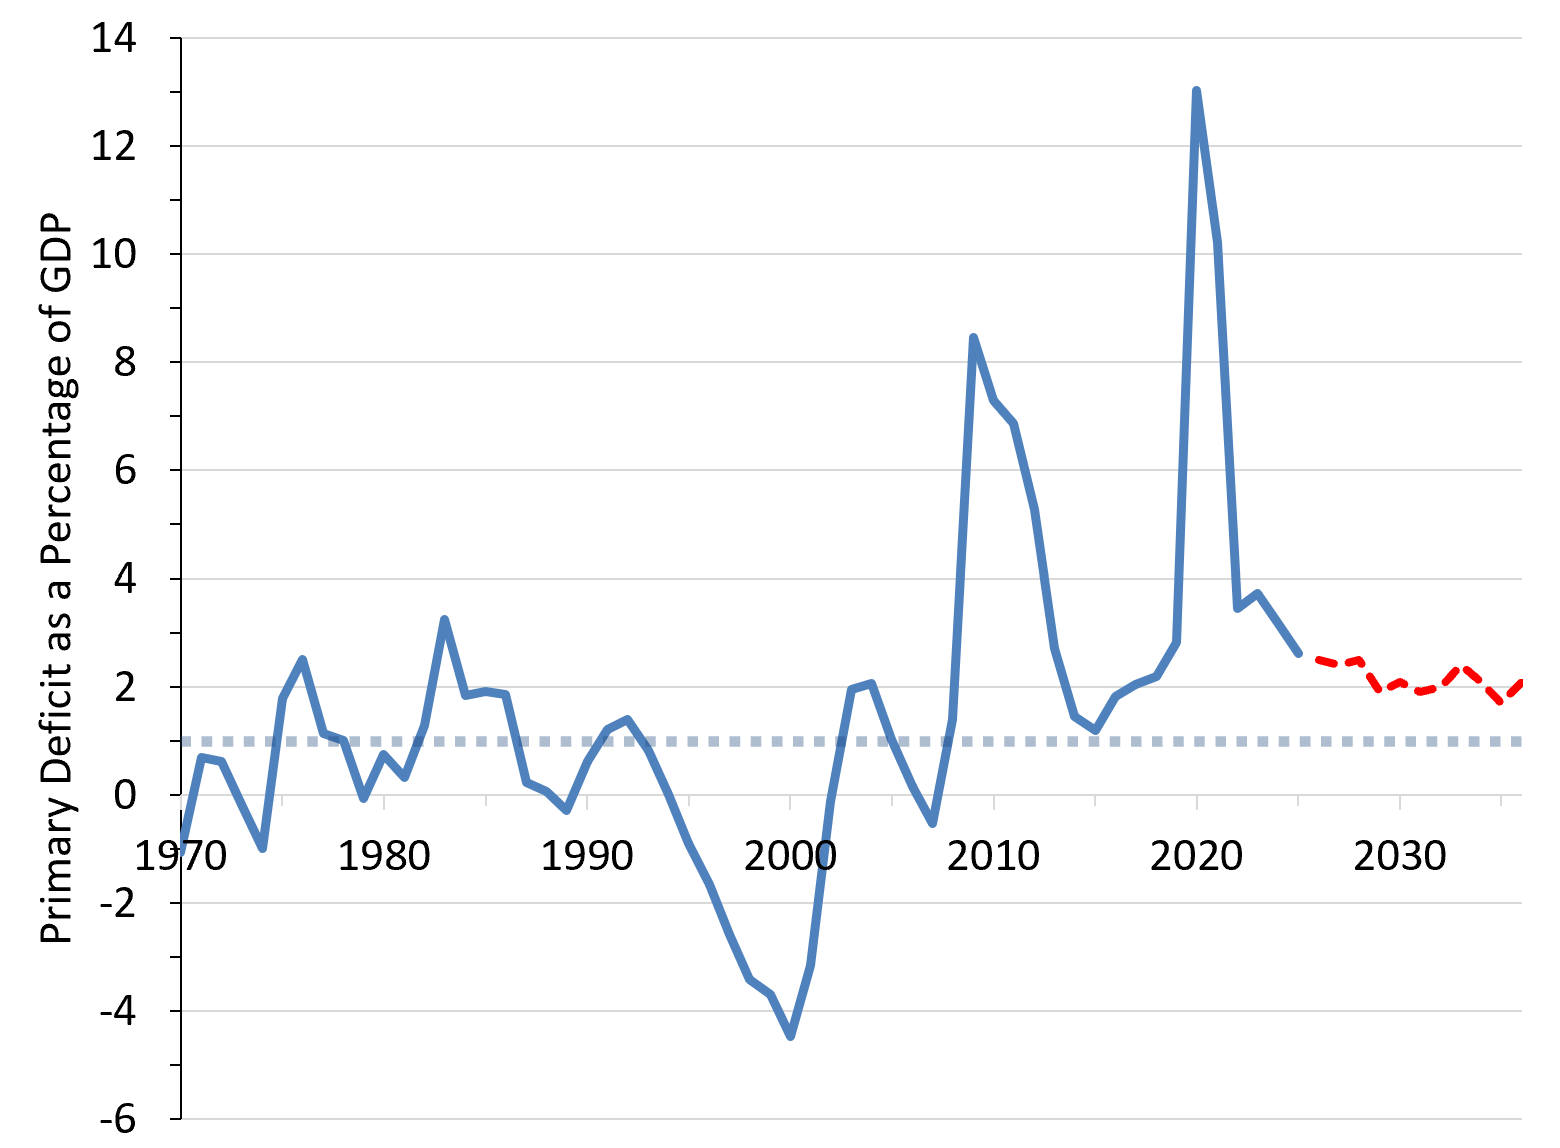
Since the GFC, the primary deficit has exceeded the 1 percent threshold needed to keep the debt-to-GDP ratio from increasing. Looking forward, the CBO projects a primary deficit of ~2 percent of GDP in 2026. Stabilizing the debt-to-GDP ratio would thus require reducing the primary deficit by about 1 percent of GDP, or roughly $325 billion per year. This amounts to a reduction of roughly 6% of annual non-interest spending given that total annual non-interest spending is on the order of about $5.5 trillion per year.
Sensitivity to the Rate of Real Economic Growth
My estimates of the maximum primary deficit-to-GDP ratio needed to stabilize the debt-to-GDP ratio going forward depend heavily on the rate of real long‑run economic growth. To illustrate this sensitivity, Figure 5 plots the maximum primary deficit‑to‑GDP ratio consistent with a stable debt‑to‑GDP ratio as we vary the assumed long‑run real growth rate while holding r fixed at 2 percent.
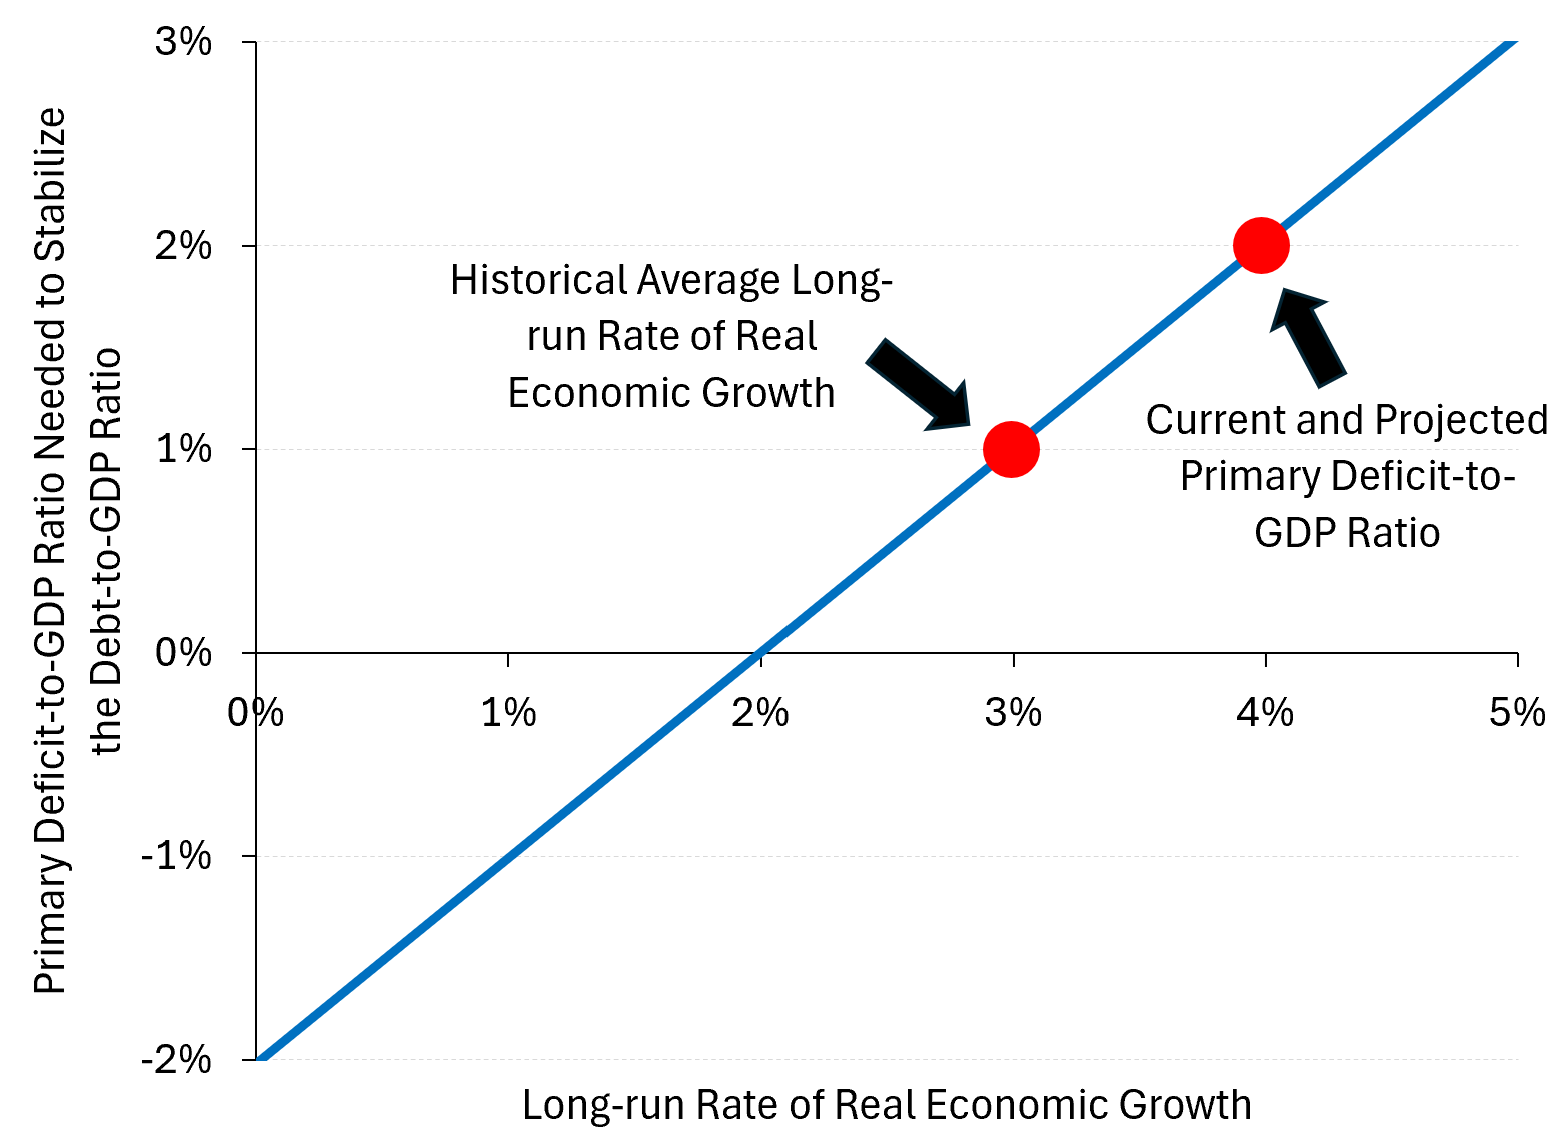
The faster the economy grows, the higher the primary deficit-to-GDP ratio can be while maintaining a constant debt-to-GDP ratio. When debt levels are near 100 percent of GDP, each additional percentage point of economic growth allows the government to sustain roughly one additional percentage point of primary deficit without increasing the debt-to-GDP ratio.
It follows that the debt-to-GDP ratio could be stabilized at its current value given the current primary deficit-to-GDP ratio of about 2 percent if real economic growth going forward averages around 4 percent per year. While not impossible, this relatively rapid real rate of economic growth would exceed the historical long-run average of 3 percent by a considerable margin.
So Is U.S. Government Debt on a Sustainable Trajectory?
Our framework implies that whether the current trajectory of U.S. government debt is sustainable ultimately depends on the relationship between economic growth, interest rates, and the primary deficit.
If real growth averages somewhere close to its historical pace of roughly 3 percent, debt stabilization would require meaningful fiscal adjustment.
If growth were to rise toward 4 percent, however, the current debt-to-GDP ratio could be stabilized with little to no adjustments in fiscal policy.
The debate over fiscal sustainability is therefore not primarily about whether today’s debt level is “too high.” It is about whether economic growth continues to outpace real interest rates, and whether policymakers can keep primary deficits within the limits implied by the arithmetic of debt dynamics.
If you enjoyed this mildly efficient and occasionally rational take on whether U.S. government debt is on a sustainable path, consider subscribing below. We’ll keep exploring markets and models, uncovering mildly surprising truths along the way.
No hot takes; just thoughtful ones.

About the Author: Seth Neumuller is an Associate Professor of Economics at Wellesley College where he teaches and conducts research in macroeconomics and finance. He holds a Ph.D. in economics from UCLA. His Substack is Mildly Efficient (and Occasionally Rational) where he explores topics in finance and macro from first principles, cutting through complexity with clear, grounded analysis.
Notes and Sources
AI tools were used to edit prose; all figures are straightforward to reproduce from the cited sources.
https://www.cbo.gov/publication/62105, accessed March 8, 2026.
https://www.cbo.gov/publication/62105, accessed March 8, 2026.
If you are interested in the painstaking algebra and approximations that allow us to derive Equation (4) from Equation (3), drop me a line and I would be happy to fill in the details :)
A reasonable proxy for r is the inflation‑adjusted yield on medium‑ to long‑term Treasury securities and for g is the growth rate of real GDP.