The Four Horsemen of the Labor Market
A deep dive into Austan Goolsbee's preferred metrics to evaluate the strength of the labor market
I was listening to an interview of Austan Goolsbee, President of the Federal Reserve Bank of Chicago, on Odd Lots last week. When asked about the labor market, he was confident we are at or very close to full employment, and that conditions are broadly in balance.
That gave me pause because recent payroll reports and revisions painted a much softer picture. The July 2025 Employment Situation Report released August 1 showed a modest 73,000 nonfarm jobs created in July and made a cumulative -258,000 revision to the May and June numbers, bringing the three month average to just 35,000 per month, a marked decline from the robust job creation we had been experiencing earlier in the year. So what was informing Goolsbee’s upbeat view of the labor market?
On the podcast, Goolsbee described four metrics that he uses to gauge the state of the labor market, what he calls the four horsemen: the vacancy rate, job‑finding rate, layoff rate, and unemployment rate. Importantly, all four are rates rather than levels (like the monthly job creation numbers I cited above). His reason for focusing on rates rather than levels is straightforward: changes in immigration flows and population growth can have an outsized influence on data like monthly job gains, whereas rate measures scale with the size of the labor force and total employment. (And we all know that immigration flows have been in flux recently, to say the least…) Goolsbee claims that these four metrics are capable of cutting through population growth and immigration flow distortions, thereby offering clear insights into the real underlying strength of the labor market.
Below, I look at each of the four horsemen in turn: where it stands now, how it compares to the pre-COVID period (2018–2019), and what the recent trend implies. Then I step back to ask whether the labor market is truly in balance as Austan Goolsbee claims it to be.
The Four Horsemen
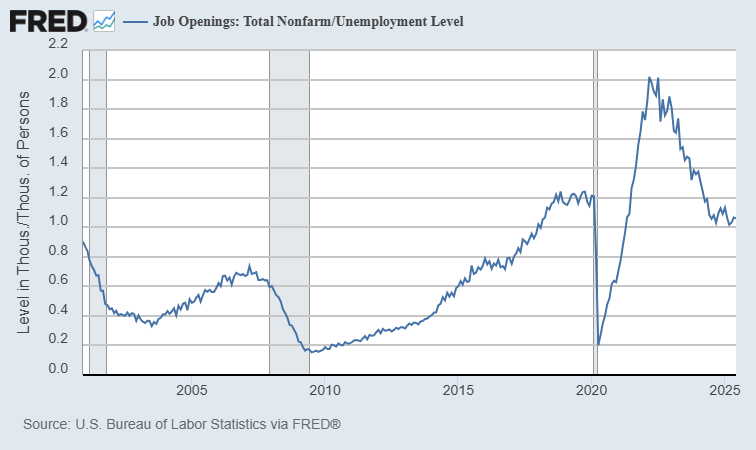
Vacancy Rate: The number of job openings per unemployed person, calculated by dividing job openings, or vacancies (V), by the number of unemployed persons (U). The vacancy rate is also sometimes referred to as labor market tightness (V/U).
Latest: ~1.06 openings per unemployed person in June 2025 (roughly one-to-one), down from a high of around 2 in early 2022.
Pre-COVID(2018–2019): Around 1.2 openings per unemployed person, on average.
Typical Behavior During a Recession: Typically falls rapidly as firms pull listings. In 2001 the drop was moderate; in 2008–09 it was dramatic.
Read: The fall in vacancy rate suggests the labor market is no longer overheated and has largely normalized toward pre-COVID balance.
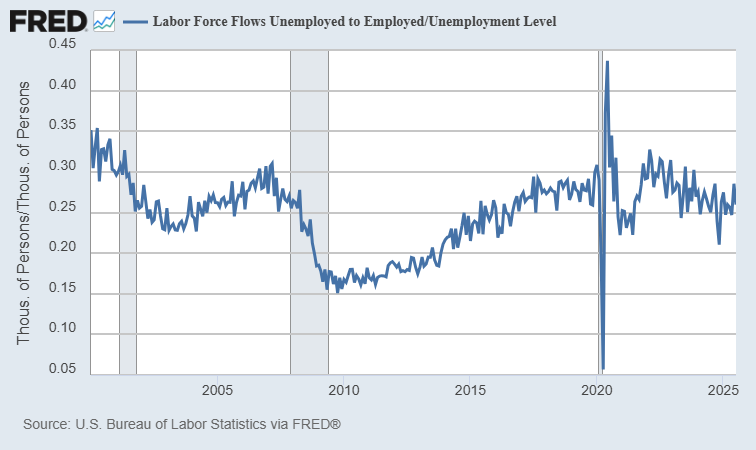
Job-Finding Rate: The odds that an unemployed worker finds a job this month, calculated as the monthly flow from unemployment (U) to employment (E), divided by the number of unemployed persons, or (U → E) ÷ U.
Latest: About 26% in July 2025.
Pre-COVID (2018–2019): About the same as today.
Typical Behavior During a Recession: Declines persistently as fewer unemployed workers land jobs each month. The 2001 downturn saw a noticeable dip; in 2008–09 it slid to the high teens, a historically weak pace, and then recovered only gradually.
Read: The job-finding rate has eased down from its early 2022 high of around 32% and is now in line with pre-COVID levels. If one horseman merits close attention, it is this one because the drift over the past year or two has been gradualy lower.
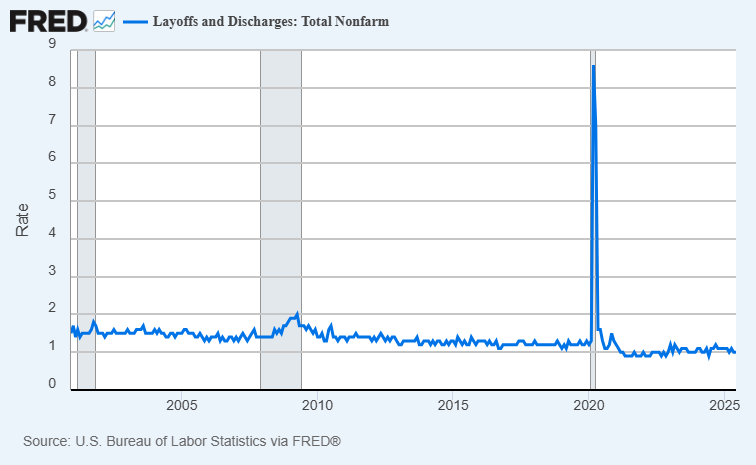
Layoff Rate: The probability that an employed worker loses their job this month, calculated by dividing the monthly number of layoffs & discharges (L) by total employment (E), or L ÷ E.
Latest: 1.0% in June 2025.
Pre-COVID (2018–2019): Around the low 1s, often a bit higher than today.
Typical Behavior During a Recession: Spikes early in downturns and then recedes. The 2001 spike was brief and modest; in 2008–09 the layoff and discharge rate for the private sector pushed up to around 2% at the peak before easing. Of the four horsemen, this and the vacancy rate are probably the best leading indicators of labor market weakness.
Read: The relatively low and stable layoff rate suggests that employers remain reluctant to fire their workers, even in the face of new tariffs.
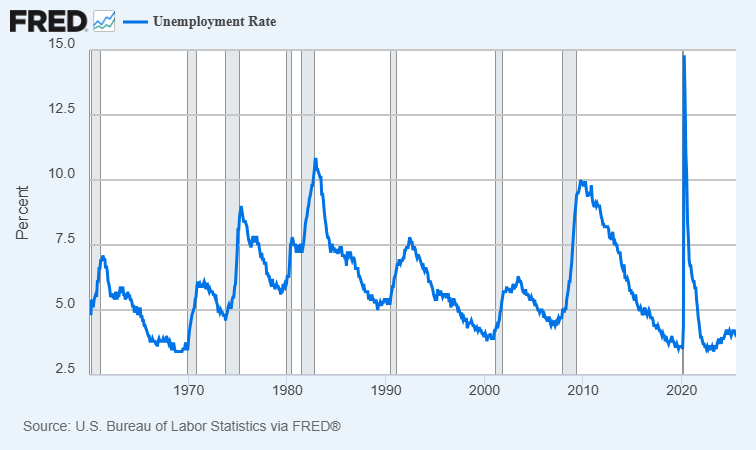
Unemployment Rate: Share of the labor force (E + U) that is not employed and is actively looking for work, or U ÷ (E+ U).
Latest: 4.2% in July 2025.
Pre-COVID (2018–2019): Ranging from 3.7–3.9%.
Typical Behavior During a Recession: Rises throughout the recession and usually peaks after it ends. It crested around 6% in the early 2000s cycle (2003) and around 10% in late 2009 during the Great Recession, then declined slowly. Of the four horsemen, this is the indicator that tends to lag the most.
Read: A notch higher than the pre-COVID period, but still low by longer run standards and fully consistent with a labor market that is near full employment.
Is the Labor Market Truly in Balance?
Here is my read on what the four horsemen of the labor market have to tell us:
Vacancy rate is back down to normal levels.
Job-finding rate is down from its peak but still healthy.
Layoff rate is low and stable.
Unemployment rate is modestly higher than 2019 but remains low by historical standards.
Taken together, today’s readings rhyme with 2018–2019: cooler than the boom, but slightly stronger than neutral. It certainly supports Goolsbee’s view that the labor market looks healthy. The most recent Employment Situation Report and associated revisions rattled financial markets, but the four horsemen point to a labor market that is cooling toward balance, not one that is signaling imminent recession.
What would change my mind? If the vacancy rate slips decisively below 1, the job‑finding rate drifts further down to below 20%, the layoff rate begins to spike, or the unemployment rate rises above 4.5% for several months, then I’d revisit the “in balance” call and probably turn pessimistic. But for now, all signs point toward a healthy labor market.
If you enjoyed this mildly efficient and occasionally rational discussion of the four horsemen of the labor market, consider subscribing below. We’ll continue exploring markets and models, revealing mildly surprising truths. No hot takes; just thoughtful ones.
About the Author: Seth Neumuller is Associate Professor of Economics at Wellesley College where he teaches and conducts research in macroeconomics and finance. He holds a Ph.D. in economics from UCLA. His substack is Mildly Efficient (and Occasionally Rational) where he explores topics in finance and macro from first principles—cutting through complexity with clear, grounded analysis.


