
The Hidden Costs of Passive Investing
Buyer beware: some S&P 500 index funds are quietly draining investor returns

Over the past two decades, investors have moved away from high-cost, actively managed mutual funds toward low-cost index funds. This is a sensible move given that while any particular fund manager may outperform the market in any given year, the likelihood that they can maintain this outperformance over the long run fades rapidly.
At the center of this investment revolution sits the S&P 500 index fund. It is the go-to vehicle for any investor seeking broad exposure to the U.S. stock market. Indeed, the top 25 S&P 500 index mutual funds had a total of nearly $2.5 trillion in assets under management (AUM) as of October 8, 2025. If we include the three most popular S&P 500 index ETFs (VOO, SPY, IVV), the total AUM of S&P 500 index funds (both mutual funds and ETFs) approaches $5.3 trillion. This staggering sum represents about 8% of the total U.S. equity market capitalization, roughly $67.8 trillion as of October 1, 2025.
In theory, these funds should all be extremely low cost. After all, they invest in the same 500 companies, weighted the same way as the underlying S&P 500 index. There is little for the fund manager to do once the fund is up and running aside from rebalancing quarterly as firms enter and leave the index. In practice, a simple automated system could manage this process at close to zero marginal cost.
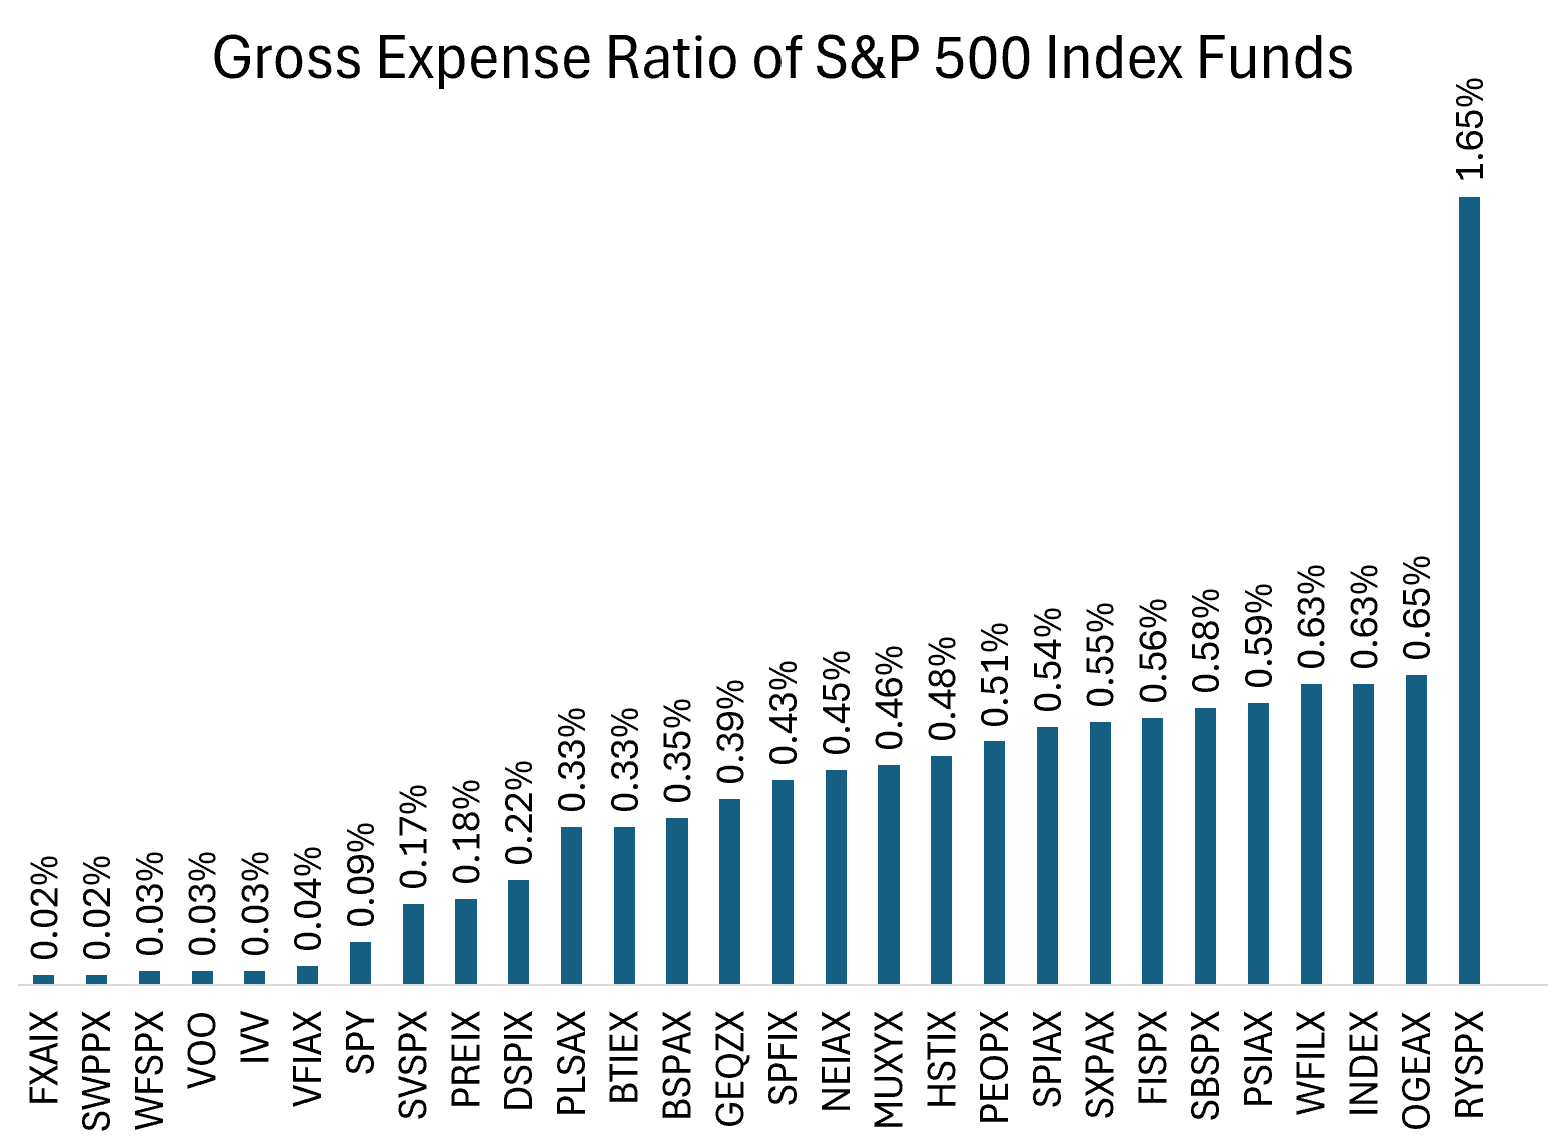
However, a quick screen of ETFs and mutual funds on the Charles Schwab platform revealed significant variation in the fees charged by S&P 500 index funds available to investors today. Given that all these funds hold the same stocks, this variation is hard to justify. It is plausible that fund companies differ in their fixed costs of operation, but the range of fees charged by essentially identical index funds is astonishing. Gross expense ratios—the preferred measure when comparing investments to be held over long horizons—range from a low of 0.02% to an egregiously high 1.65% (looking at you, Rydex Funds).
For the financially savvy investor, this should be an easy decision: choose the cheapest fund and move on. Yet the data suggest many investors are doing exactly the opposite.
When I looked at AUM, large sums of money were sitting in funds with far higher costs than the cheapest available option. In particular, the 22 funds with the highest gross expense ratios hold a combined $815 billion in AUM and charge investors an average gross expense ratio of 0.49%, a full 47 basis points above the lowest-cost competition.
These basis points add up. When weighted by AUM, the 22 highest-cost funds are quietly siphoning off nearly $1 billion per year in excess fees, not in exchange for top-tier fund managers working hard to beat the market, but by simply following Standard and Poor’s instructions.
A difference of 40 or 50 basis points (0.40% to 0.50%) in gross expense ratios between otherwise identical S&P 500 index funds may sound trivial. But over decades, those small annual fee differences compound dramatically.
Let’s walk through an example to make this point more salient:
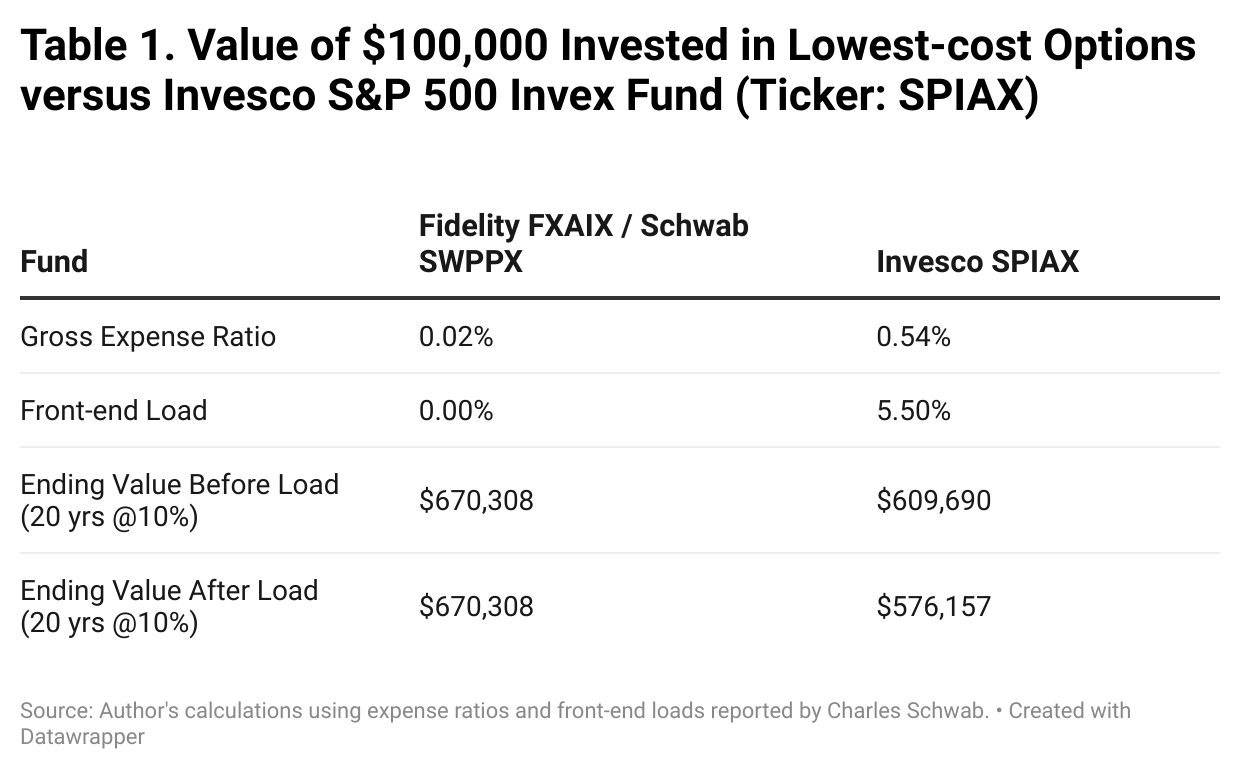
Suppose you invested $100,000 in the Invesco S&P 500 mutual fund (Class A, ticker SPIAX) with a 0.54% gross expense ratio. If the S&P 500 returns 10% annually for 20 years, you’d end up with $609,690. The same investment in Fidelity’s FXAIX or Schwab’s SWPPX, both charging just 0.02%, would grow to $670,308. That’s a $60,000 difference for the same underlying investment!
The math is simple but powerful. The table below shows how small fee differences snowball over time.
To make matters worse, some S&P 500 index fund options also charge what are called “loads.” These fees, which range from 0% up to as high as 5.5%, are levied when you invest in the fund.
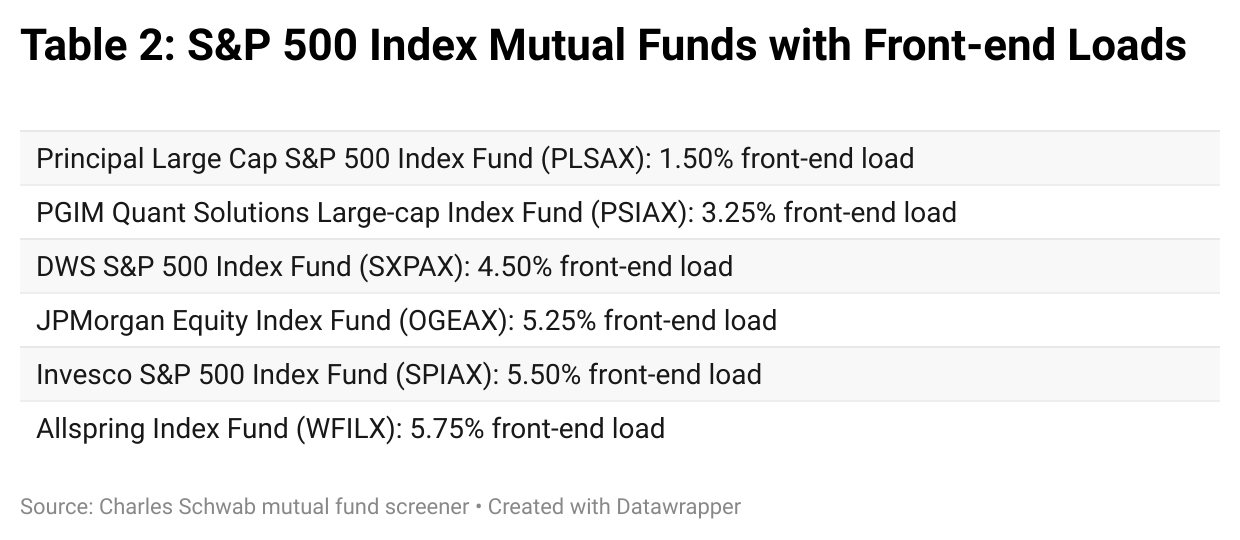
In addition to charging investors a full 52 basis points more than the lowest-cost options, the Invesco S&P 500 mutual fund (Class A, ticker SPIAX) also levies a 5.50% front-end load. Returning to our example, if you invest $100,000 in the Invesco fund and the S&P 500 returns 10% annually over the next 20 years, your investment will have grown to just $576,157. The front-end load alone reduces your account value by another $34,000, leaving you with about $94,000 less than if you had simply invested in the lowest-cost alternative.
So what explains this persistence of high-cost funds in a supposedly efficient market?
A few possibilities:
Low financial literacy. Research by Annamaria Lusardi and Olivia Mitchell shows that many Americans struggle with basic financial concepts such as compound interest and inflation. If investors do not grasp how small fee differences accumulate, they may not see a problem worth fixing.
Advisor incentives. Some advisors still receive compensation, directly or indirectly, from the funds they recommend. That can steer clients toward higher-cost products even when cheaper, identical ones exist.
Inertia and confusion. In my own work with Casey Rothschild, “Financial Sophistication and Portfolio Choice Over the Life Cycle” published in the Review of Economic Dynamics (October 2017), we show how limited financial knowledge reinforces this inertia, leading investors to hold suboptimal portfolios and pay unnecessary fees. Mutual fund menus cluttered with share classes and fine print only make matters worse.
The irony is that the S&P 500 index fund, pioneered by John Bogle of Vanguard, was supposed to democratize investing by letting everyone capture market returns without the friction of high fees or opaque strategies. Somewhere along the way, simplicity got rebranded—and repriced. Indexing was meant to make investing easier for individuals. But as the data show, even simplicity demands vigilance.
The takeaway is simple: if you are buying the same index, you should never pay more for it. Check the fund’s expense ratio, avoid load fees, and make sure your advisor’s incentives align with your own. If your financial advisor put you in a high-cost S&P 500 index fund, it’s not too late to find a new one—but it’s long past time to ask why.
Notes and Sources
AI tools were used to help transform raw data into figures and to edit prose; all calculations are straightforward to reproduce from the cited sources.
If you enjoyed this mildly efficient and occasionally rational take on the hidden costs of passive investing, consider subscribing below. We’ll continue exploring markets and models, revealing mildly surprising truths.
No hot takes; just thoughtful ones.

About the Author: Seth Neumuller is an Associate Professor of Economics at Wellesley College where he teaches and conducts research in macroeconomics and finance. He holds a Ph.D. in economics from UCLA. His Substack is Mildly Efficient (and Occasionally Rational) where he explores topics in finance and macro from first principles, cutting through complexity with clear, grounded analysis.