

When I teach intermediate macroeconomics, I tell students that we can use growth in real GDP per capita as a proxy for changes in living standards across countries and over time.
This approach is motivated by the fact that real GDP per capita is highly correlated with many things we ultimately care about, including access to basic necessities, health, and life expectancy.
I also offer the standard caveat that GDP per capita only measures average living standards. It tells us nothing about how income is distributed across the population.
It turns out that this distinction may be quite important for understanding how living standards have changed over the past six decades in the U.S.
One readily available measure that gets closer to the experience of the typical household is real median household income. Rather than taking an average across all households, the median reports the income of the household in the middle of the distribution.
Figure 1 plots these two measures of economic progress. Between 1967 and 2025, real GDP per capita in the United States increased by about 184 percent, corresponding to average annual growth of 1.81 percent. Over the same period, real median household income increased by only about 57 percent, or 0.78 percent per year.1
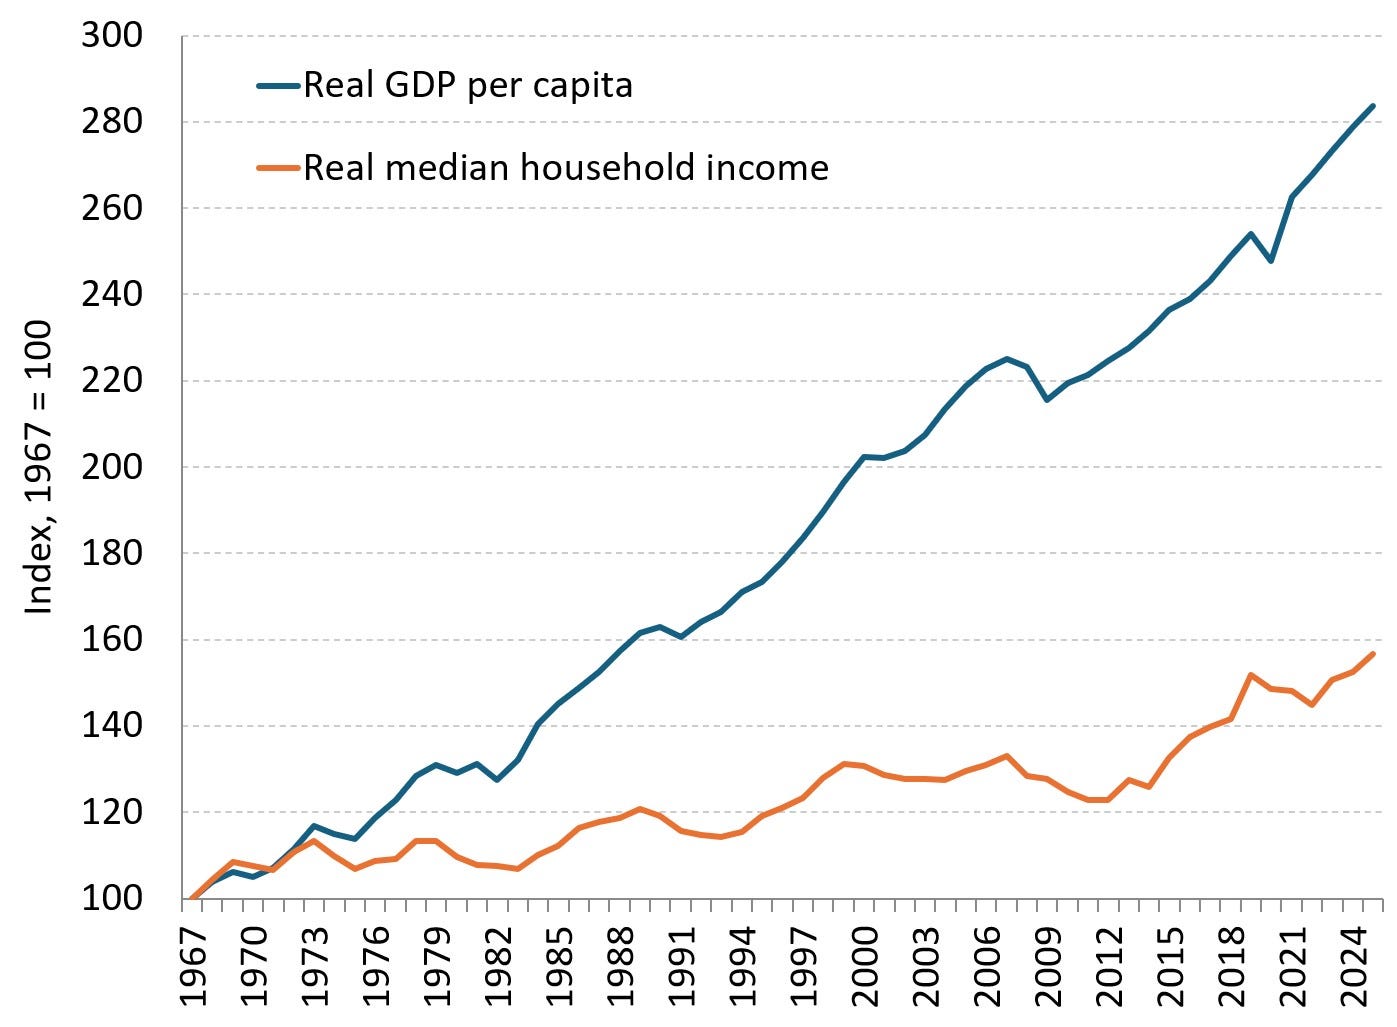
These two measures give very different impressions of how much living standards have improved over the last 60 years. Looking only at real GDP per capita suggests very large gains, whereas looking at real median household income suggests much more modest increases in living standards for the typical household.
Seeing this comparison made me worry that I may have been too casual about what growth in real GDP per capita implies about the experience of the typical household. It also made me want to understand why these two measures have diverged so much over the past six decades.
Decomposing the difference
To this end, let m denote real median household income, m̄ real mean household income, N average household size, and y real GDP per capita. Then real GDP per capita can be written as:
The three terms on the right-hand side of this equation give us a sequential bridge from median household income, m, to real GDP per capita, y. The first puts median household income on a simple per-person basis, the second moves from the median to the mean, and the third captures the remaining difference between mean household income per person and real GDP per capita.
Figure 2 shows the results of this exercise.
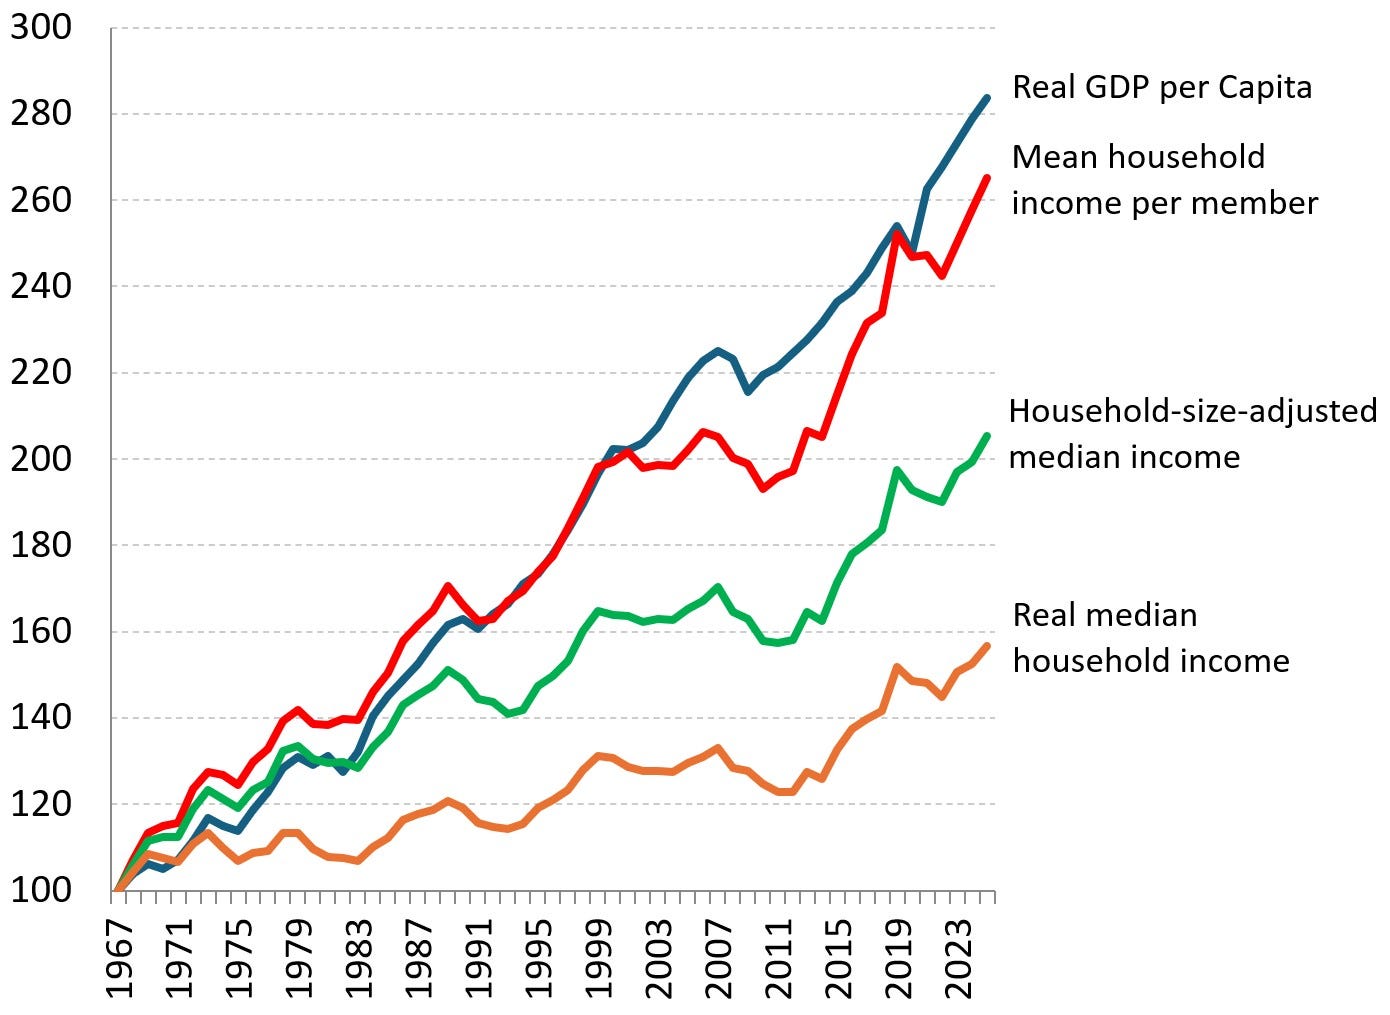
Real median household income increased by about 57 percent between 1967 and 2025 (orange line). But average household size fell from about 3.28 people to 2.50 over this period. After adjusting for changes in average household size, real median household income increased by about 106 percent between 1967 and 2025 (green line).2 On a simple per-person basis, then, household-size-adjusted median income roughly doubled.
The widening gap between mean and median income explains most of the remaining difference.
In 1967, real median household income was about $55,850, compared with mean household income of roughly $62,465, both expressed in 2025 dollars. Thus, back in 1967, median household income was 89 percent of the mean.
By 2025, median income had risen to about $87,460, while mean income had increased to roughly $126,227. So by 2025, median household income represented just 69 percent of the mean.
And it follows that mean household income per person increased by about 165 percent (red line), compared with 106 percent for the median (green line).3
The residual gap is relatively small. Real GDP per capita increased by 184 percent (blue line), compared with the 165 percent increase in mean household income per person (red line).4
The decomposition therefore points to two main reasons why real GDP per capita has grown so much faster than real median household income. Households have become smaller, and income at the middle of the distribution has grown more slowly than average household income.
Concluding Thoughts
Real GDP per capita remains an extremely useful measure of economic growth over long periods of time. But because it is an average, it becomes less representative of the experience of the typical household as the income distribution becomes more unequal.
Put differently, using real GDP per capita as a proxy for changes in living standards would suggest that living standards have nearly tripled since 1967. Household-size-adjusted median income suggests that living standards for the typical household have roughly doubled. That is a substantial difference, and one I need to be more careful about when using growth in real GDP per capita as a proxy for changes in living standards over time and across countries.
If you enjoyed this mildly efficient and occasionally rational take on the divergence between real GDP per capita and real median household income since 1967 and its implications for changes in living standards, consider subscribing below. We’ll keep exploring markets and models, uncovering mildly surprising truths along the way.
No hot takes; just thoughtful ones.

About the Author: Seth Neumuller is an Associate Professor of Economics at Wellesley College where he teaches and conducts research in macroeconomics and finance. He holds a Ph.D. in economics from UCLA. His Substack is Mildly Efficient (and Occasionally Rational) where he explores topics in finance and macro from first principles, cutting through complexity with clear, grounded analysis.
Notes and Sources
AI tools were used for proofreading and language editing.
Real GDP per capita is from the U.S. Bureau of Economic Analysis, accessed through FRED (series A939RX0Q048SBEA). The series is reported quarterly in chained 2017 dollars; annual values are averages of the four quarterly observations.
Median and mean household income are from the U.S. Census Bureau’s Historical Income Tables: Households and Income in the United States: 2025. The Census household-income series are based on money income reported in the Current Population Survey Annual Social and Economic Supplement. The dollar values quoted in the text are expressed in 2025 dollars.
Average household size is from the U.S. Census Bureau’s Historical Households Tables, Table HH-6, “Average Population Per Household and Family: 1940 to Present.”
The analysis begins in 1967 because this is the earliest year for which the Census provides consistent household-level data on both mean and median income.
This per-person adjustment abstracts from economies of scale within households. Using a conventional square-root equivalence scale instead would imply an increase of roughly 80 percent, so the 106 percent figure should be viewed as an upper-end adjustment for the effect of declining household size.
The same decomposition can be expressed in terms of average annual growth rates. Using compound annual growth rates, the gap between growth in real GDP per capita and real median household income is about 1.04 percentage points per year. Of that difference, about 0.47 percentage points reflect the decline in average household size, 0.45 percentage points reflect slower growth in median relative to mean household income, and the remaining 0.12 percentage points reflect the difference between growth in mean household income per person and GDP per capita.
The remaining difference reflects, at least in part, the fact that GDP and household money income capture different economic concepts. GDP includes depreciation, retained corporate earnings, imputed housing services and government production that do not appear in Census household money income. Household money income also excludes some forms of compensation and transfers, and the two series use different price indexes.