Will AI alter the economy’s long run growth trajectory?
Unless this time is different, probably not
AI feels different. The newest large language models can scan and summarize vast amounts of data in seconds and handle tasks once thought uniquely human. If advances in AI lead to faster innovation cycles and greater productive capacity, the payoff could be an economy that grows faster and raises living standards more quickly than ever before. But will AI truly bend the long-run growth curve, pushing U.S. living standards upward at a faster pace for decades to come than they have risen in the past?
Measuring Economic Growth and Some Growth Facts
If you could only choose one metric to track changes in living standards over time, real GDP per capita, or average income per person, is a pretty good candidate. It moves with things we care about: education, literacy rates, access to healthcare and clean water, incidence of preventable disease, and, maybe most importantly, life expectancy. And by dividing real GDP by the size of the population, we strip out the effect of simply having more people, thus allowing us to focus on changes in average income per person (real GDP per capita) over the long run.
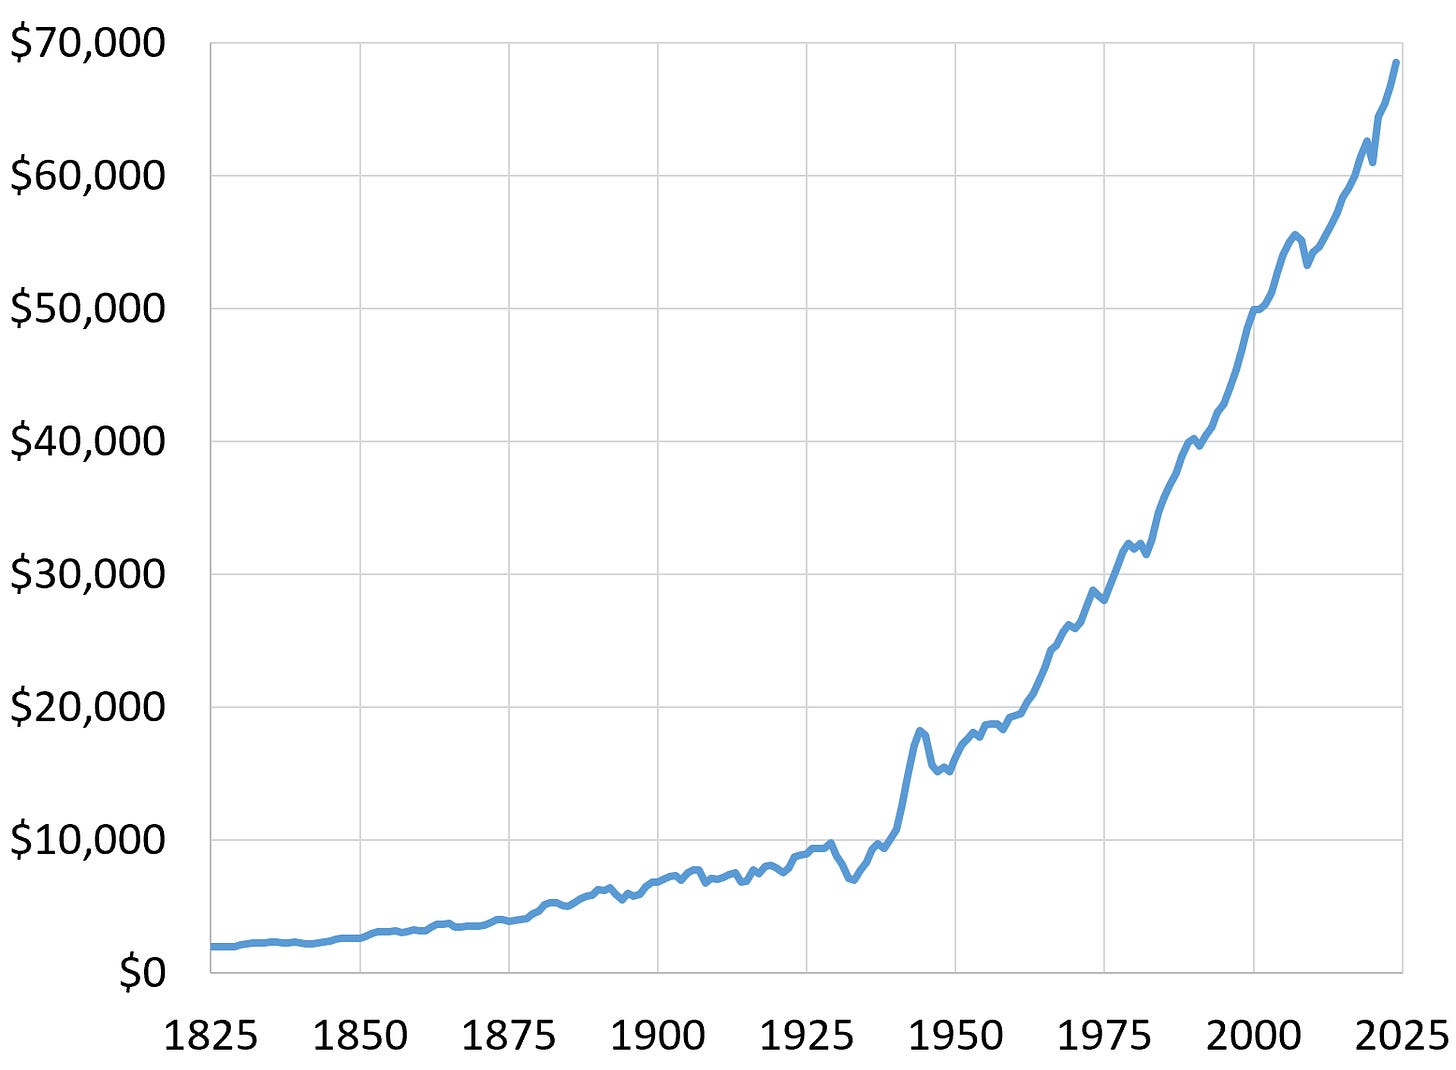
Figure 1 shows U.S. real GDP per capita from 1825 to 2024, expressed in constant 2017 dollars. In 1825, the average American earned just $1,966 per year. By 2024, average income per person had risen to $68,501. That’s not just a bit more. It’s about 35 times more!
Figure 1. Real GDP per capita in the U.S. from 1825 to 2024. Source: Measuring Worth, “What was the U.S. GDP then?”
On average, this works out to an average annual growth rate of 1.8% per year. This might sound low. But the Rule of 70 tells us that at this pace, living standards double roughly every 39 years. This means that over the past 200 years, living standards in the U.S. doubled more than five times! That’s the quiet superpower of compounding, year after year of small gains stacking into something enormous.
At first glance, the line in Figure 1 looks like it’s getting steeper as we move to the right. This might tempt you to think that growth has been speeding up. But growth is a percentage change: it’s the yearly change in real GDP per capita divided by its level. In this chart, both the yearly change and the level are rising as we move to the right, making it difficult to tell whether the growth rate of real GDP per capita is rising, falling, or remaining the same.
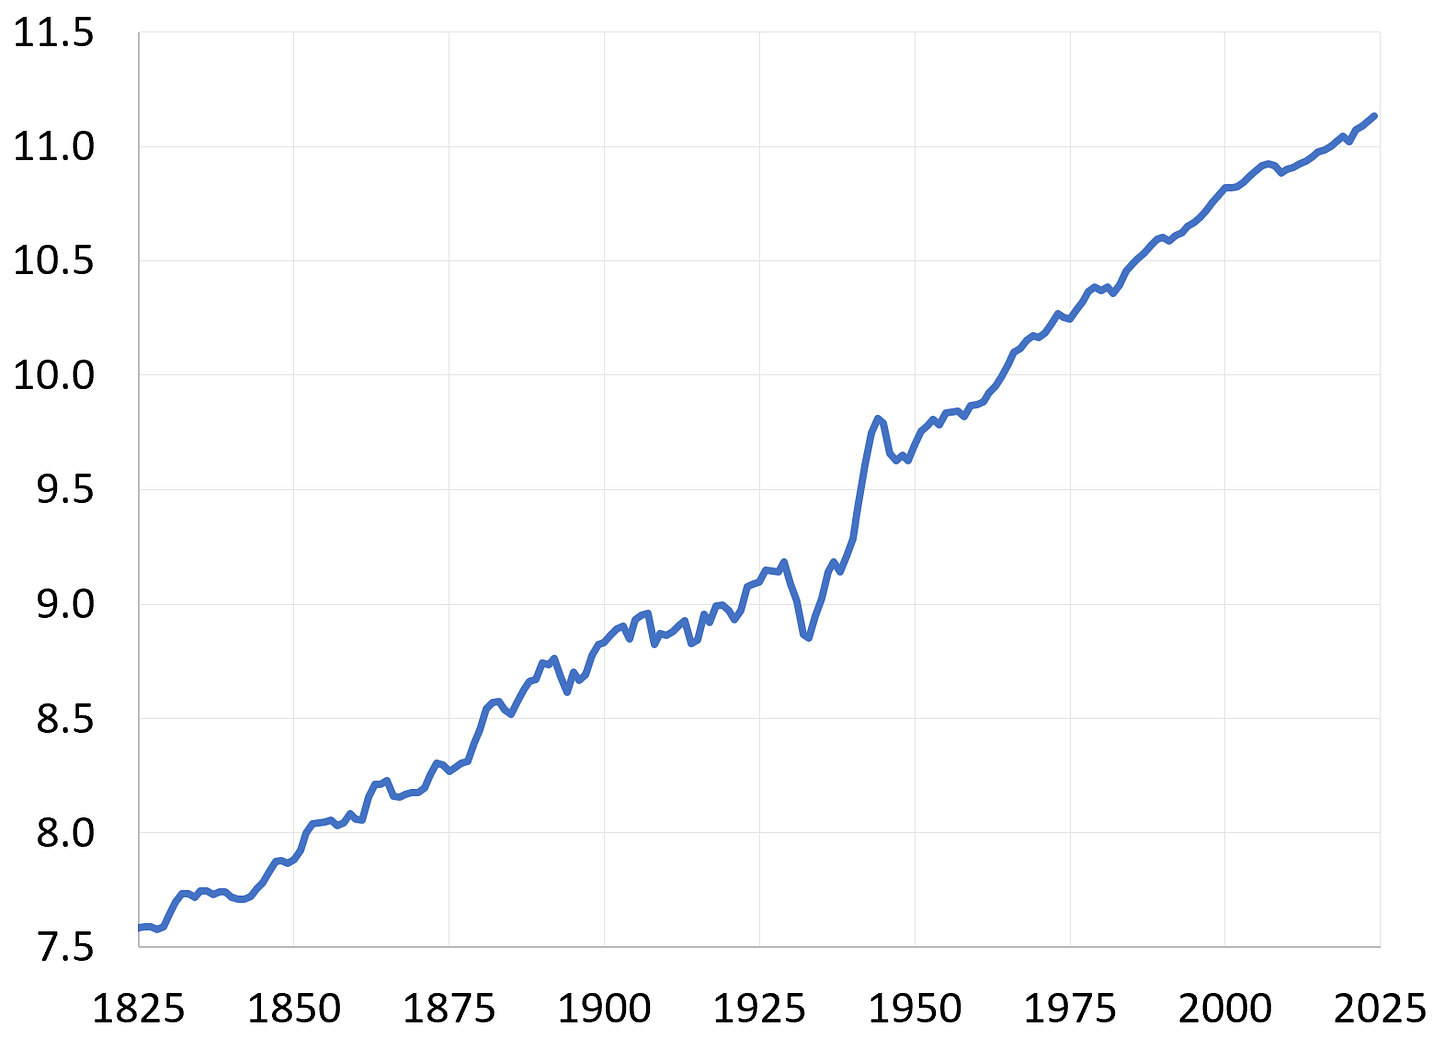
The way to settle this question is to plot the natural log of real GDP per capita, as shown in Figure 2. Growth rates are percentage changes, and taking logs turns percentage changes into regular differences. This is really useful because it means that the slope of the graph of the natural log of a growing economic variable is the variable’s growth rate. So, on a log chart, if we see the slope of the line steepening, this means the growth rate is rising, and vice versa. Likewise, if the slope is constant, it means the growth rate is steady.
Figure 2. The natural log of real GDP per capita in the U.S. from 1825 to 2024. Source: Author’s calculations using data from Measuring Worth, “What was the U.S. GDP then?”
Now, you might have expected to see some drift in the slope over time, reflecting an acceleration (or deceleration) in economic growth in the U.S. over the long run. After all, the past two centuries have been full of technological advances (e.g., electrification, industrial revolution, just-in-time manufacturing, the invention of computers, the internet, and so on). Indeed, there are periods in Figure 2 where we can see economic growth in the U.S. accelerating, like in the run-up to WWII, and decelerating, like during the Great Depression. But what I find remarkable is that through all this change, the line in Figure 2 remains remarkably straight over the long run!
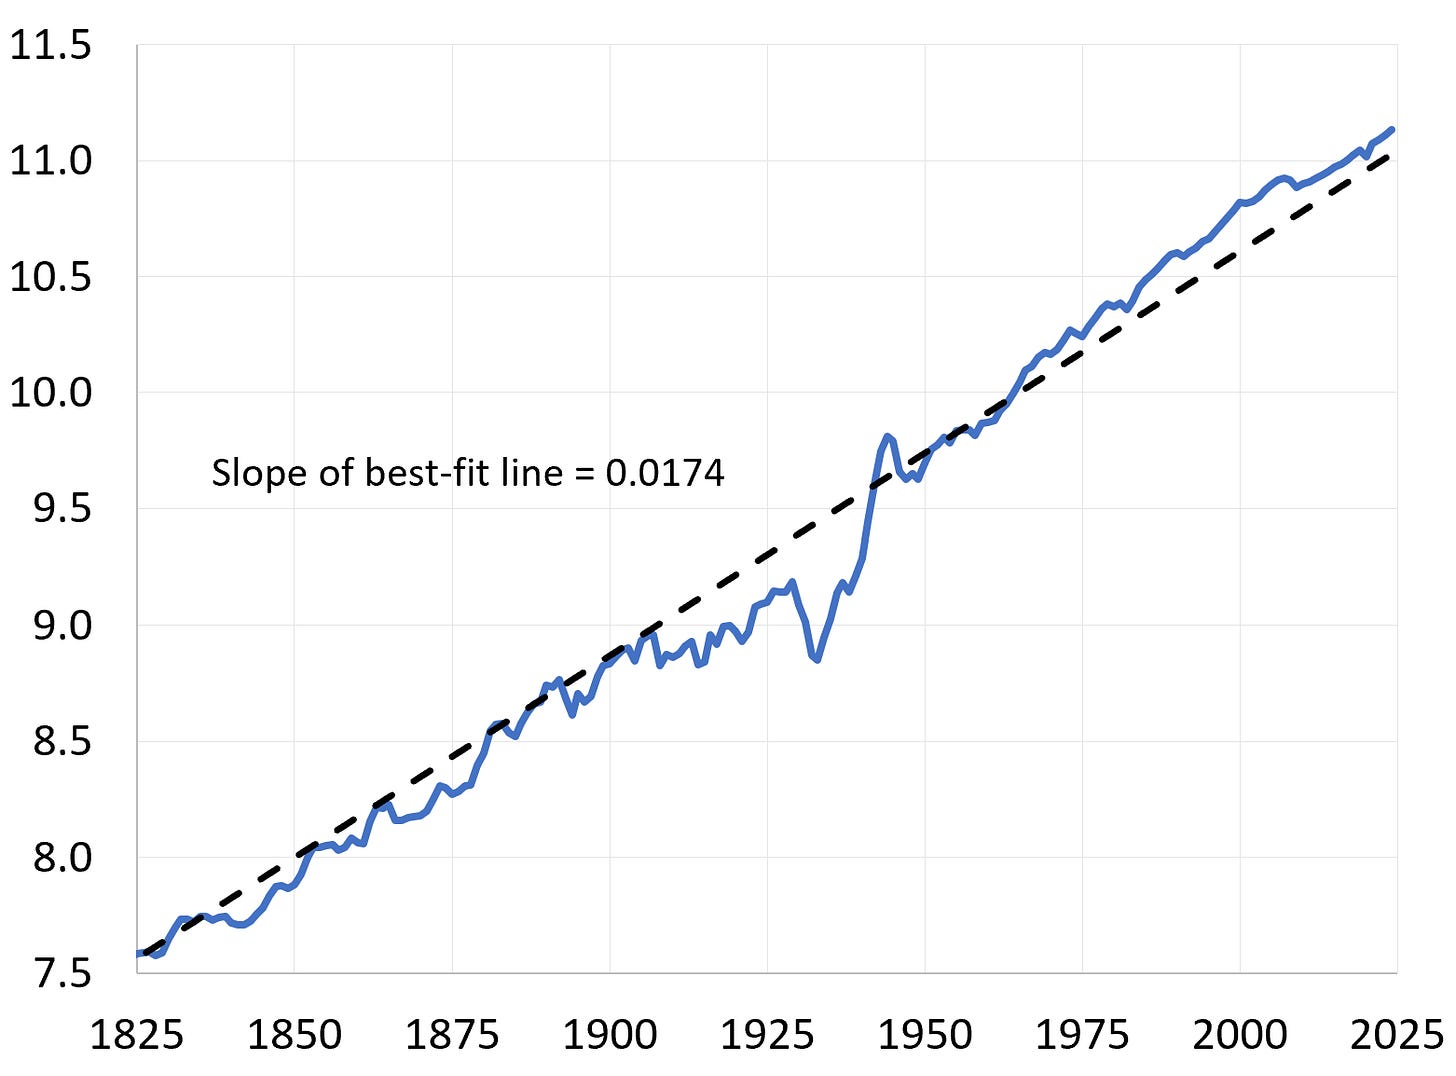
We can see this even more clearly by adding a best fit line to the graph, as I have done in Figure 3. If U.S. economic growth was accelerating, we would expect to see the distance between the data (blue line) and the best-fit line (black dashed line) expanding over time, or vice versa. Instead, what we see is that the data remains relatively close to the best-fit line throughout this 200-year period.
Figure 3. The natural log of real GDP per capita in the U.S. from 1825 to 2024 (solid blue) with best fit trendline (dashed black). Source: Author’s calculations using data from Measuring Worth, “What was the U.S. GDP then?”
The slope of the best-fit line has a useful interpretation. It is another way to estimate the average annual growth rate of real GDP per capita over the last 200 years. In this case, we get about 1.7% per year, which is quite close to the 1.8% per year we calculated above using just the first and last data points in our sample.
What does this all mean? It means that over the past 200 years, economic growth in the U.S. has been astonishingly stable. Yes, sometimes growth accelerates and sometimes growth decelerates, but real GDP per capita always seems to come back to its long run growth path, as represented by the best-fit line.
Since the best-fit line, by definition, has a constant slope, this means that over the long run, we haven’t witnessed any technological advancements or changes in the way the U.S. economy operates that have permanently altered the economy’s long run growth trajectory.
This is one of the most remarkable economic facts (i.e., statements made by raw data) that I have seen in my career as an economist.
So much has changed over the last 200 years. The U.S. has endured a civil war, the end of slavery, mass immigration, rapid urbanization, the Industrial Revolution, electrification, the spread of the automobile, the dawn of commercial aviation, two world wars, the Great Depression, the creation of the Federal Reserve, globalization, women entering the workforce in large numbers, the baby boom, the information technology revolution, the internet age, a housing crash, the Great Recession, and two pandemics (among other things). Yet through all of this, the long-run growth path of the U.S. economy has remained remarkably stable.
Will AI Permanently Accelerate U.S. Economic Growth?
History suggests that even the most transformative innovations often deliver only temporary boosts to growth. We like to think of railroads, electricity, the automobile, and the internet as game changers that permanently accelerated economic growth. And in the short run, they often do. You can see these bursts in the data as periods where the line in Figure 2 steepens. But over the long run, the economy seems to settle back to roughly the same pace of economic growth; 1.8% or so per year on a per capita basis.
If AI follows the same script, we might see a period of faster growth as businesses reorganize, new industries emerge, and labor productivity accelerates. This would manifest itself as a steepening in the slope of the line in Figure 2. This short-lived surge might make it seem like we’re entering a new era of economic prosperity.
The surprise is what usually comes next. Past technological revolutions plateau once the easy productivity gains are exhausted. This is known as the Iron Logic of Diminishing Returns. It says that marginal gains tend to shrink over time as increases in efficiency become harder and harder to come by. As a result, the slope flattens back to its long-run average, and growth resumes its familiar pace. If AI follows this same pattern, we may look back in 50 years and find that, for all its disruption, it simply gave us another temporary lift along an otherwise unshakable trend.
That doesn’t mean the impact will be trivial. The transition to an AI integrated world could bring rapid changes in employment, income, and the competitive landscape. Some workers will see their roles transformed, others will need to retrain, and entirely new categories of jobs may appear.
The lesson from the past two centuries isn’t that nothing changes. It’s that the long-run growth rate of the U.S. economy is remarkably resistant to change. And if AI can’t move that number permanently, it wouldn’t be the first transformative technology to fall short of bending the long-run growth curve.
As they say, “this time is different” are four of the most dangerous words in economics.
If you enjoyed this mildly efficient and occasionally rational discussion of AI’s potential to accelerate economic growth over the long run, consider subscribing below. We’ll continue exploring markets and models, revealing mildly surprising truths. No hot takes; just thoughtful ones.
About the Author: Seth Neumuller is an Associate Professor of Economics at Wellesley College where he teaches and conducts research in macroeconomics and finance. He holds a Ph.D. in economics from UCLA. His substack is Mildly Efficient (and Occasionally Rational) where he explores topics in finance and macro from first principles—cutting through complexity with clear, grounded analysis.


