
What is the Neutral Rate of Interest?
Forget the models and look at what the data are telling us.

The appropriate stance of monetary policy today is a hotly debated topic. Many policymakers and economists argue that a softening labor market is a sign that monetary policy is too restrictive and that the Federal Reserve should respond by cutting the Federal Funds Rate further. Others point to record-high asset prices and a revival of Covid-era speculation as evidence that monetary policy is too loose, meaning the Fed should either raise the Federal Funds Rate or, at the very least, refrain from further cuts.
Given these opposing views, how can we tell whether monetary policy is accommodative, restrictive, or just right? The answer lies in comparing the current real Federal Funds Rate with the neutral rate of interest, the unobservable, inflation-adjusted Federal Funds Rate that neither stimulates nor restrains the economy, often referred to as r-star.1
Identifying the neutral rate of interest is crucial because it serves as a benchmark for judging whether monetary policy is stimulating or restraining the economy. But estimating r-star is easier said than done, and much harder to get right in real time.
The Elusive r-star
Estimating r-star has long challenged economists and policymakers alike. By definition, the neutral rate cannot be directly observed; it must be inferred from the data.
Over the years, economists have constructed increasingly sophisticated models in an attempt to estimate r-star. The best-known model, developed by Laubach and Williams (2003) and later extended following the Covid-19 pandemic by Holston, Laubach, and Williams (2023), attempts to pin down the neutral rate empirically using data on interest rates, output, and inflation. Other models add factors like demographics, productivity, or risk preferences.
Estimates of the neutral rate vary widely across models and shift significantly over time (Figure 1). One of the main sources of time variation in estimates of the neutral rate, as pointed out by Laubach and Williams (2003), is the growth rate of potential output appears to vary over time, and potential output itself is unobservable and can only be inferred from the data.
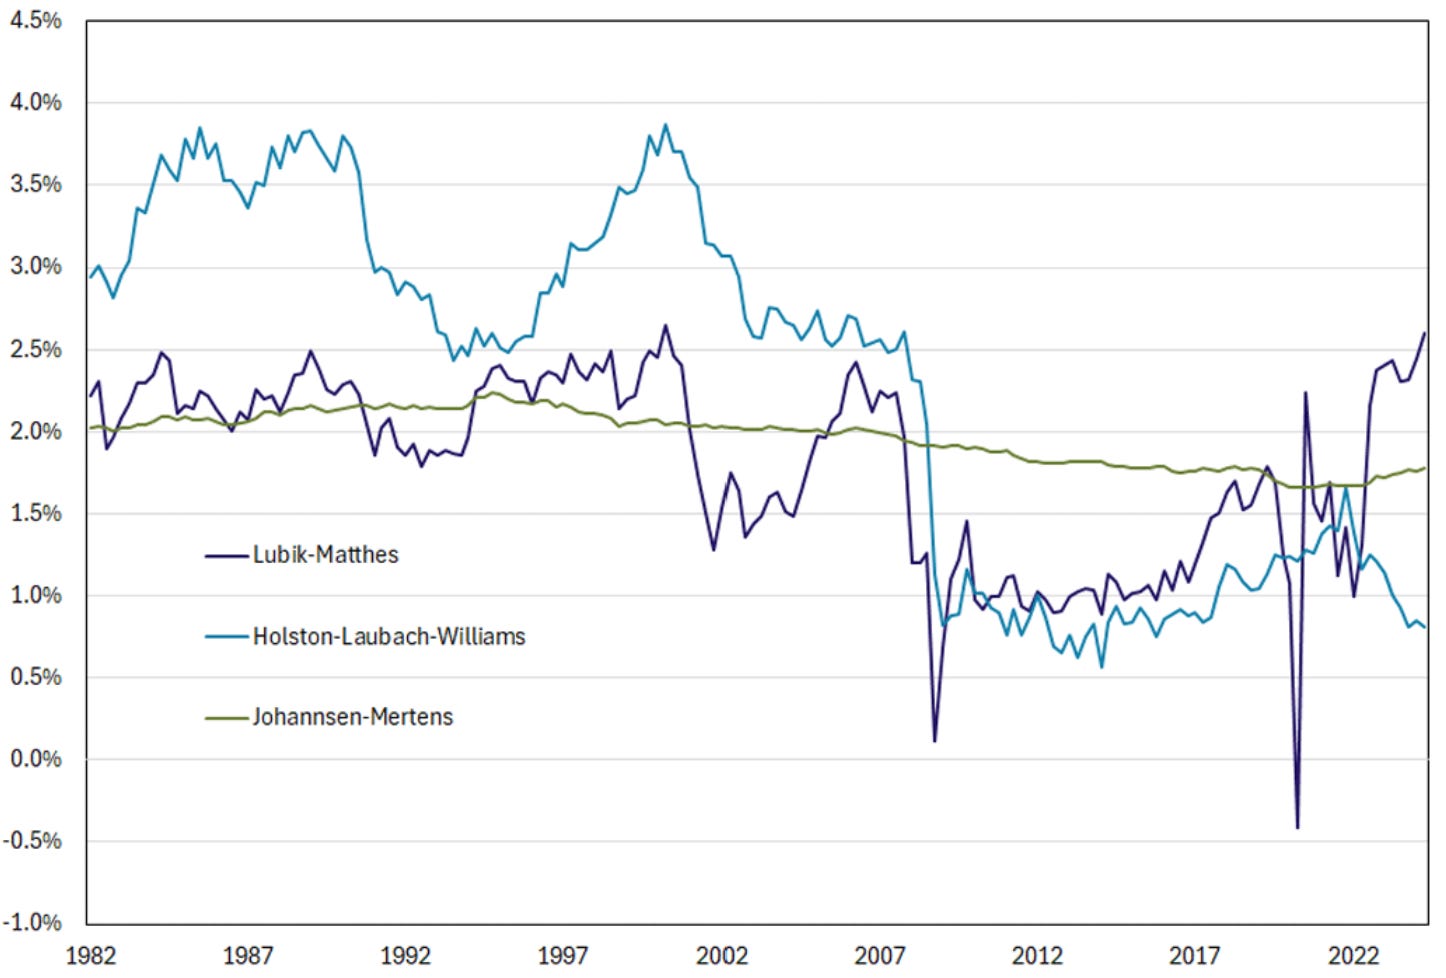
The disagreement between models and their variance over time makes it difficult to employ them with any confidence in practice. Indeed, even John C. Williams, President of the New York Fed and the “Williams” in Laubach and Williams (2003) and Holston, Laubach, and Williams (2023), cautions against taking the estimates derived from these models too seriously:
“Although these estimates are useful for analysis and transparency, policymakers are well advised to avoid placing too great confidence in precise estimates of the stars in making real-world assessments and decisions. Given the wide range of uncertainties, acting as if one knows the star variables when making policy can lead to persistent deviations of inflation from the target that risk unmooring inflation expectations.” John C. Williams, August 25, 2025
From Theory to Practice
Instead of estimating the neutral rate with a statistical model, we can just ask whether the economy is running hot, cold, or just right based on publicly-available economic data. This is not dissimilar to what the Fed appears to do in practice based on its public-facing communication.
The Fed’s dual mandate of stable prices and maximum employment define what “just right” looks like. If unemployment is near its natural rate (around 5 percent) and inflation near 2 percent, then the inflation-adjusted Federal Funds Rate is likely close to the neutral rate.2
The challenge, of course, is that the economy is inherently dynamic—it’s constantly changing over time. It is only when we encounter a period of relative economic stability that determining whether the neutral rate is above, below, or very close to the current inflation-adjusted policy rate is feasible.
To this end, the neutral rate is simply the inflation-adjusted policy rate that keeps inflation and unemployment near their targets. If the economy is running hot, with inflation above 2 percent and unemployment below 5 percent, then the neutral rate must be above the current rate. Conversely, if the economy is running cold, with inflation below 2 percent and unemployment above 5 percent, then the neutral rate must be below the current rate.
The Bullseye Analogy
To visualize this concept, consider the classic Phillips Curve, which plots the relationship between unemployment and inflation. Historically, as one falls, the other tends to rise, producing a downward-sloping curve. Now layer concentric circles around the Fed’s 2 percent inflation and 5 percent unemployment targets (Figure 2). The inflation-adjusted Federal Funds Rate that is able to maintain the economy within the innermost of the concentric circles (i.e., the bullseye) is the neutral rate.
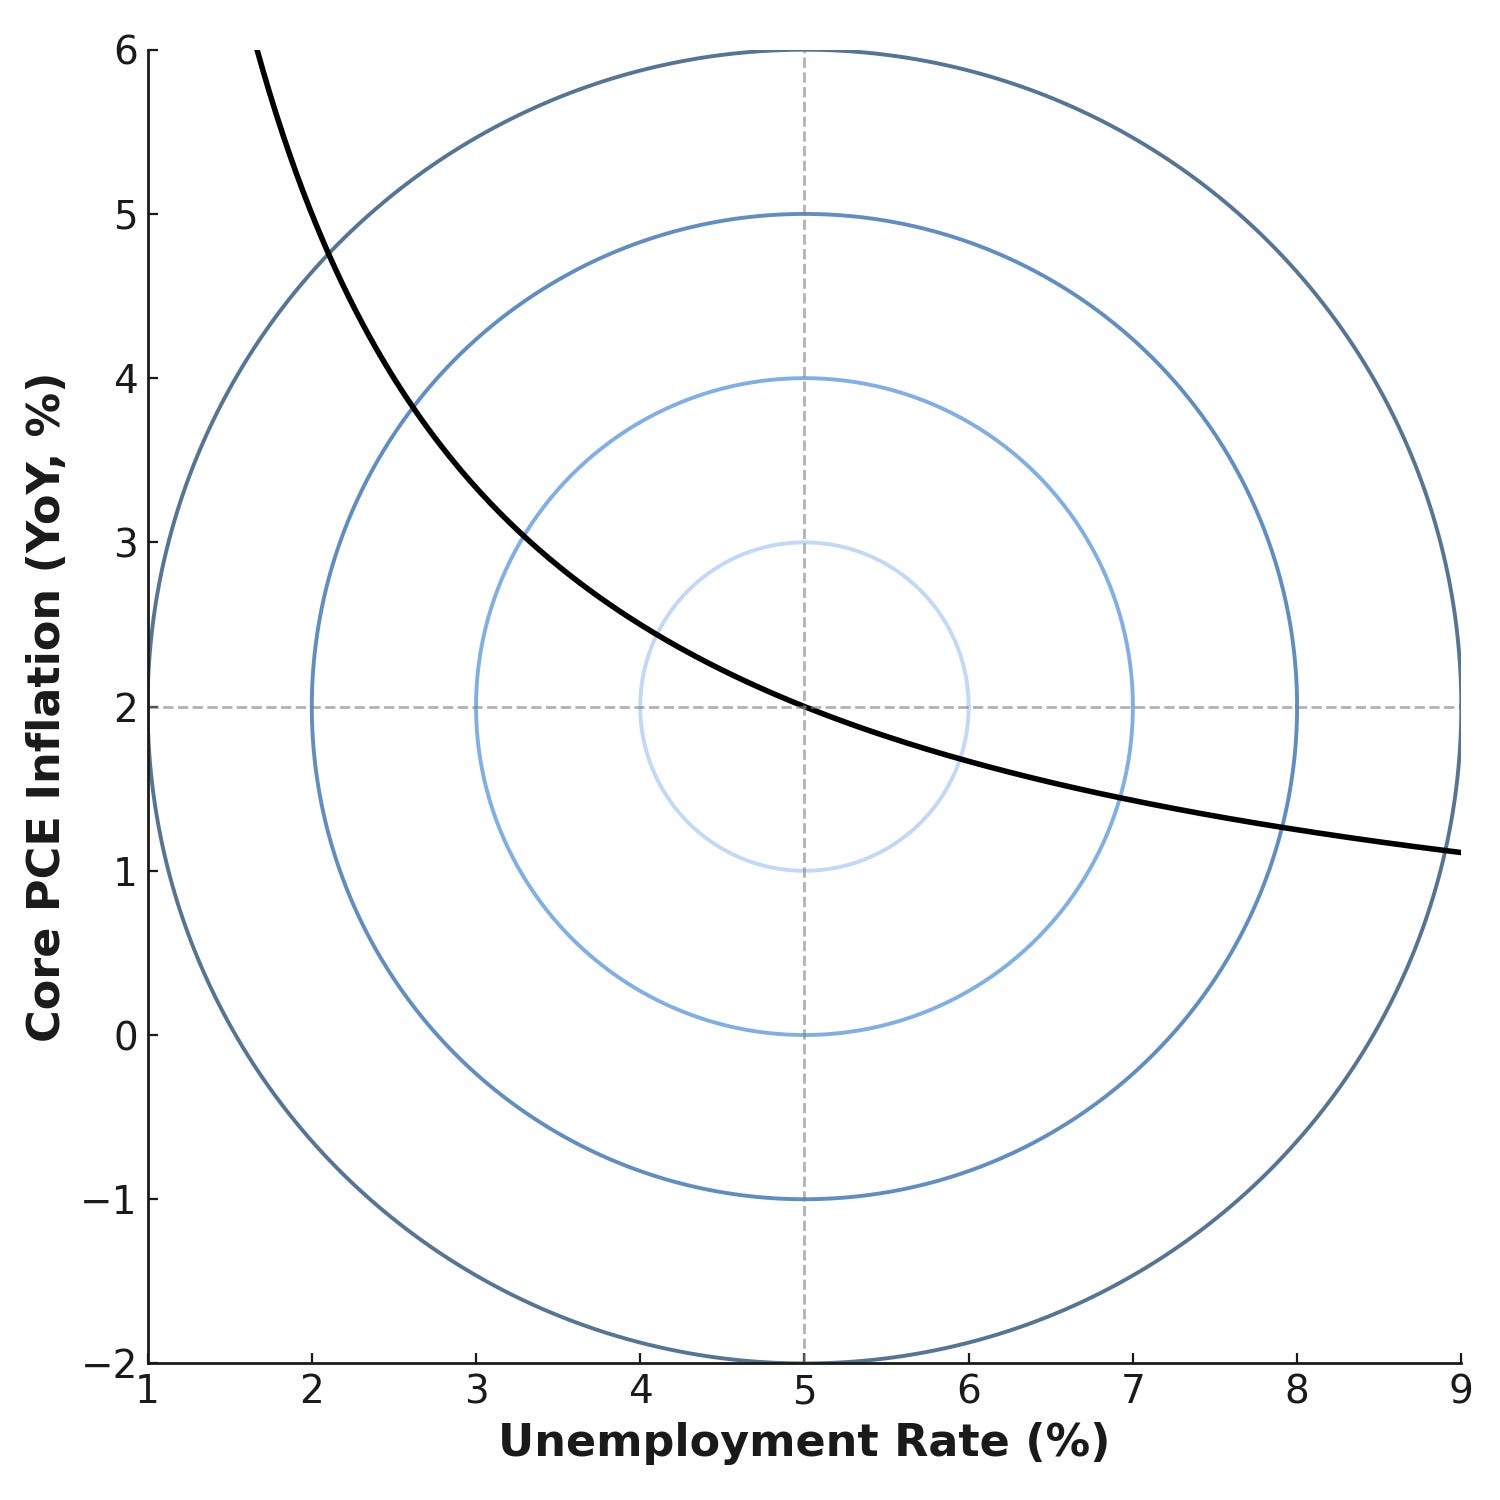
This practical approach to estimating the neutral rate doesn’t rely on a model, or set of restrictive assumptions. It simply identifies where the economy stands relative to the Fed’s targets. The implications for the neutral rate then follow directly.
Implications for the Current Policy Debate
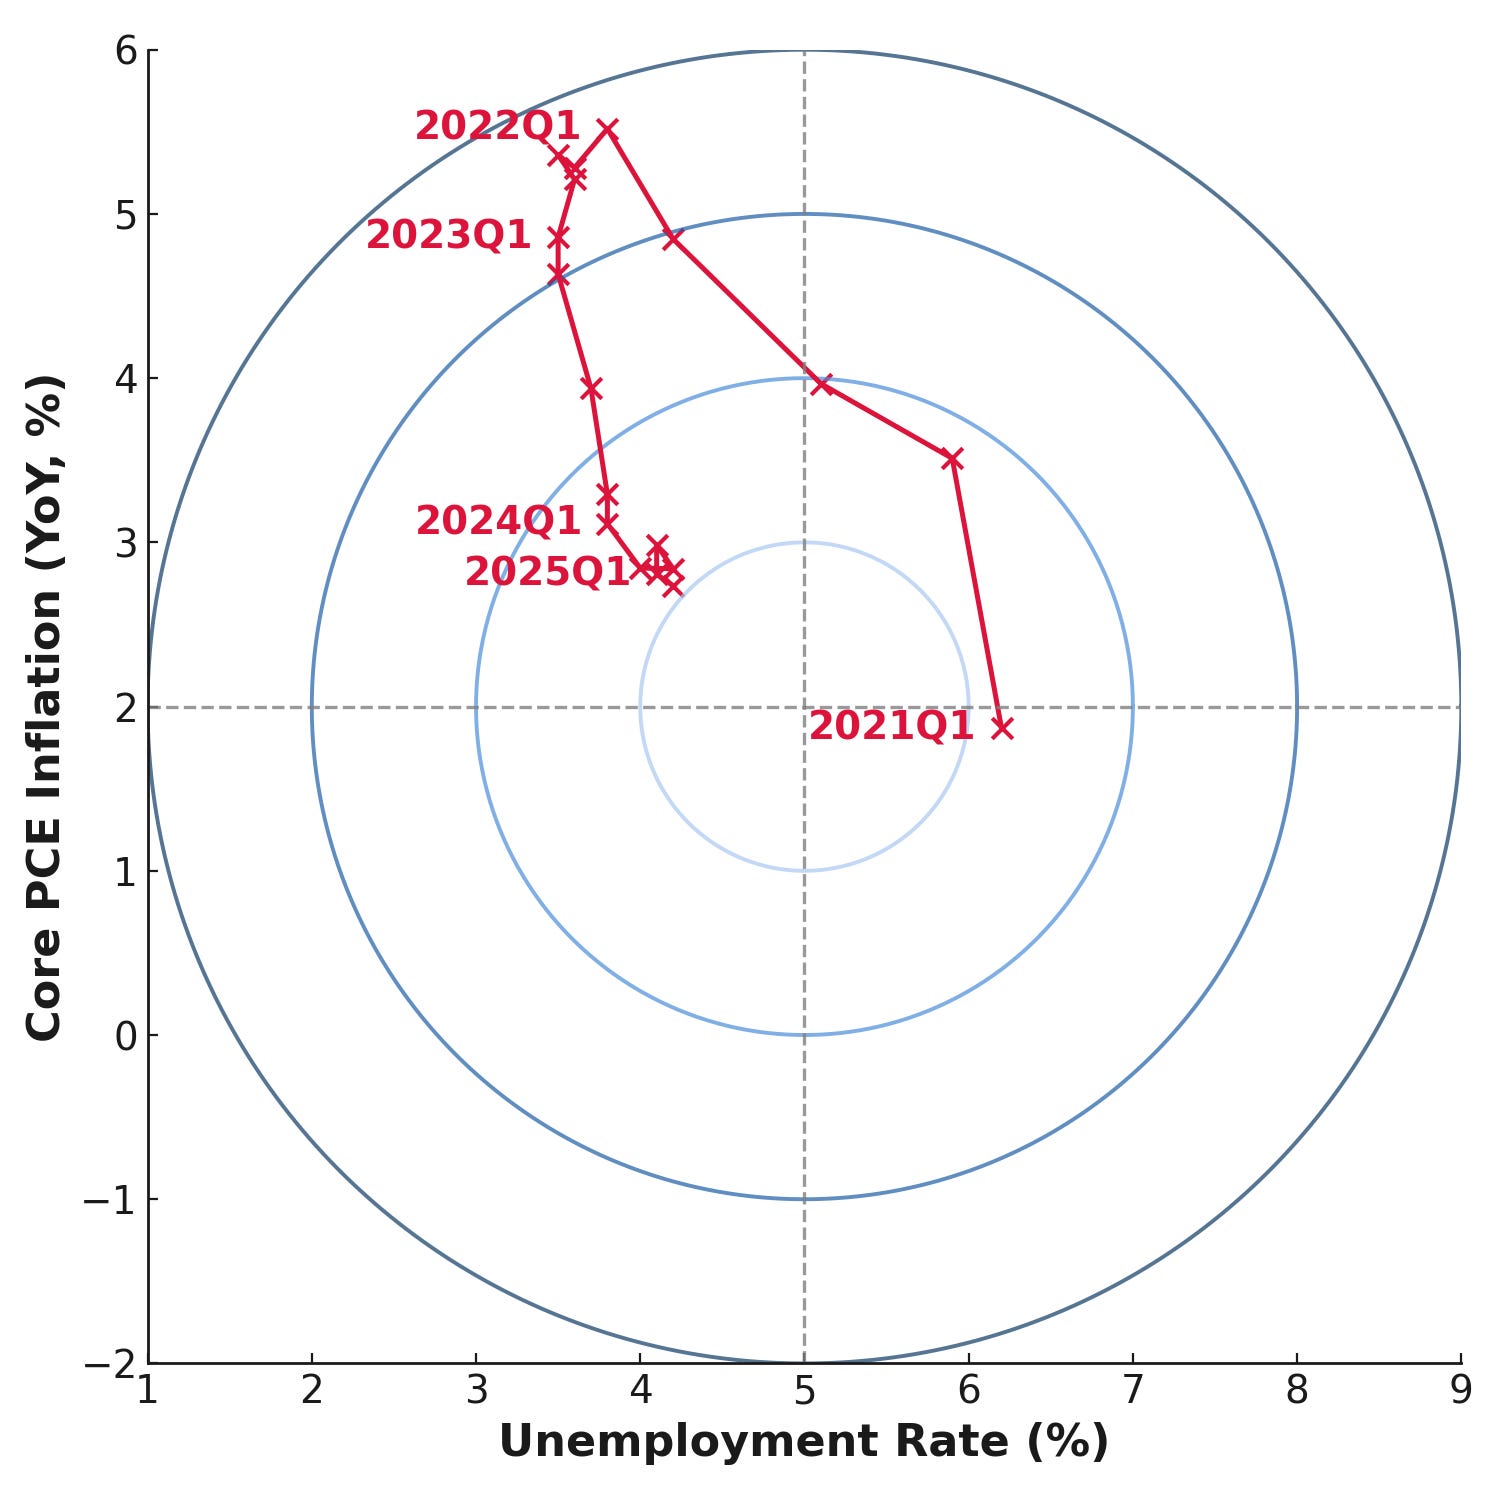
Figure 3 plots the economy’s path in inflation and unemployment space since late 2021. In the wake of the pandemic, inflation rose well above the Federal Reserve’s 2 percent target while unemployment fell well below 5 percent. The rate hikes of 2022 and 2023 gradually brought inflation down toward the Fed’s goal. During this period, unemployment edged higher but has remained comfortably under 5 percent.
Thinking about policy through this lens makes it easier to interpret where we stand. When inflation and unemployment both sit near their targets, the economy is effectively at the bullseye in the diagram. Deviations in either direction signal that policy may be too loose or too tight. The value of this framework is that it lets us judge policy not by unreliable estimates of r-star, but by outcomes we can actually observe in the data.
As Figure 3 shows, inflation and unemployment have both remained within a relatively tight band since late 2023. After nearly two years of stability, the economy looks remarkably balanced. This is precisely the environment in which to ask whether the neutral rate is above, below, or roughly equal to the current inflation-adjusted policy rate.
At present, core PCE inflation is running near 2.9 percent year-over-year, unemployment is 4.3 percent, and the Atlanta Fed’s GDPNow estimate puts third-quarter real GDP growth around 3.8 percent. By most measures, the economy remains strong and well above the Federal Reserve’s long-run targets.
These numbers suggest that the current stance of monetary policy is not especially restrictive; the neutral rate is likely equal to, or perhaps even higher than, the current inflation-adjusted Federal Funds Rate. In other words, what the Fed considers tight might be neutral, or even loose, when judged through the lens of this framework.
Despite the economy’s strength, the Federal Reserve has begun easing. At its most recent meeting, policymakers trimmed the Federal Funds Rate, perhaps out of concern that the labor market is nearing a tipping point where unemployment could begin to rise sharply. That fear is understandable, and the risk of overshooting is real.
But this concern is not currently supported by the data. In my previous post on the “Four Horsemen” of the labor market, I showed that key rate-based indicators of labor market health—job finding, quits, layoffs, and unemployment duration—continue to signal labor market strength, not weakness.
Economists and Fed officials may continue to debate where r-star lies, but the economy has already given its answer. For nearly two years, inflation has remained just north of the Fed’s target, unemployment has stayed low, and economic growth has been robust. By these measures, policy is not too tight. If anything, it is slightly too loose, suggesting that the neutral rate is likely close to, or perhaps even higher than, the current inflation-adjusted Federal Funds Rate.
Notes and Sources
AI tools were used to help transform raw data into figures and to edit prose; all calculations are straightforward to reproduce from the cited sources.
If you enjoyed this mildly efficient and occasionally rational take on the neutral rate of interest, consider subscribing below. We’ll continue exploring markets and models, revealing mildly surprising truths.
No hot takes; just thoughtful ones.

About the Author: Seth Neumuller is an Associate Professor of Economics at Wellesley College where he teaches and conducts research in macroeconomics and finance. He holds a Ph.D. in economics from UCLA. His Substack is Mildly Efficient (and Occasionally Rational) where he explores topics in finance and macro from first principles, cutting through complexity with clear, grounded analysis.
For clarity, the nominal Federal Funds Rate is the stated policy rate (i.e., the one that garners all of the headlines). The real Federal Funds Rate adjusts for expected inflation and better reflects the true stance of monetary policy.
Just as with the neutral rate of interest, there is also disagreement regarding the natural rate of unemployment.