
The Monthly Payroll Print Is Mostly Noise
Why investors should fade one of the most-watched economic indicators

Every month, market observers and journalists treat the BLS payroll report as if it were a precise reading of the labor market. The most recent release, published November 20, estimated that nonfarm payrolls rose by 119,000 in September.
At first glance, this print appears to show that the labor market remains on solid footing.
But the monthly payroll print is not a precise measure of job growth in the economy. It is a statistical estimate with substantial sampling error, as I alluded to in my last piece. Indeed, the BLS reports that the standard deviation of the monthly payroll estimate is roughly 83,000 jobs.1
Using the familiar 95 percent confidence interval, which corresponds to roughly two standard deviations around the estimate, the actual change in nonfarm payrolls during September almost certainly lies somewhere between -43,000 and +281,000.
In other words, a reported gain of +119,000 is consistent with anything from a modest contraction to strong growth in hiring. And this interval applies to the final, fully processed estimate, the one produced after two rounds of revisions, when nearly all survey responses have been received. The initial estimate, which is the version that makes the headlines each month, carries even more uncertainty because it is only based on a subset of the full sample.
What Sampling Error Looks Like
To see this more clearly, imagine the economy actually added a modest +50,000 jobs last month. Given the sampling error, repeated BLS-sized samples of the actual economy can plausibly produce reported changes in monthly nonfarm payrolls that range from strongly negative to strongly positive, purely because of statistical noise (Figure 1).
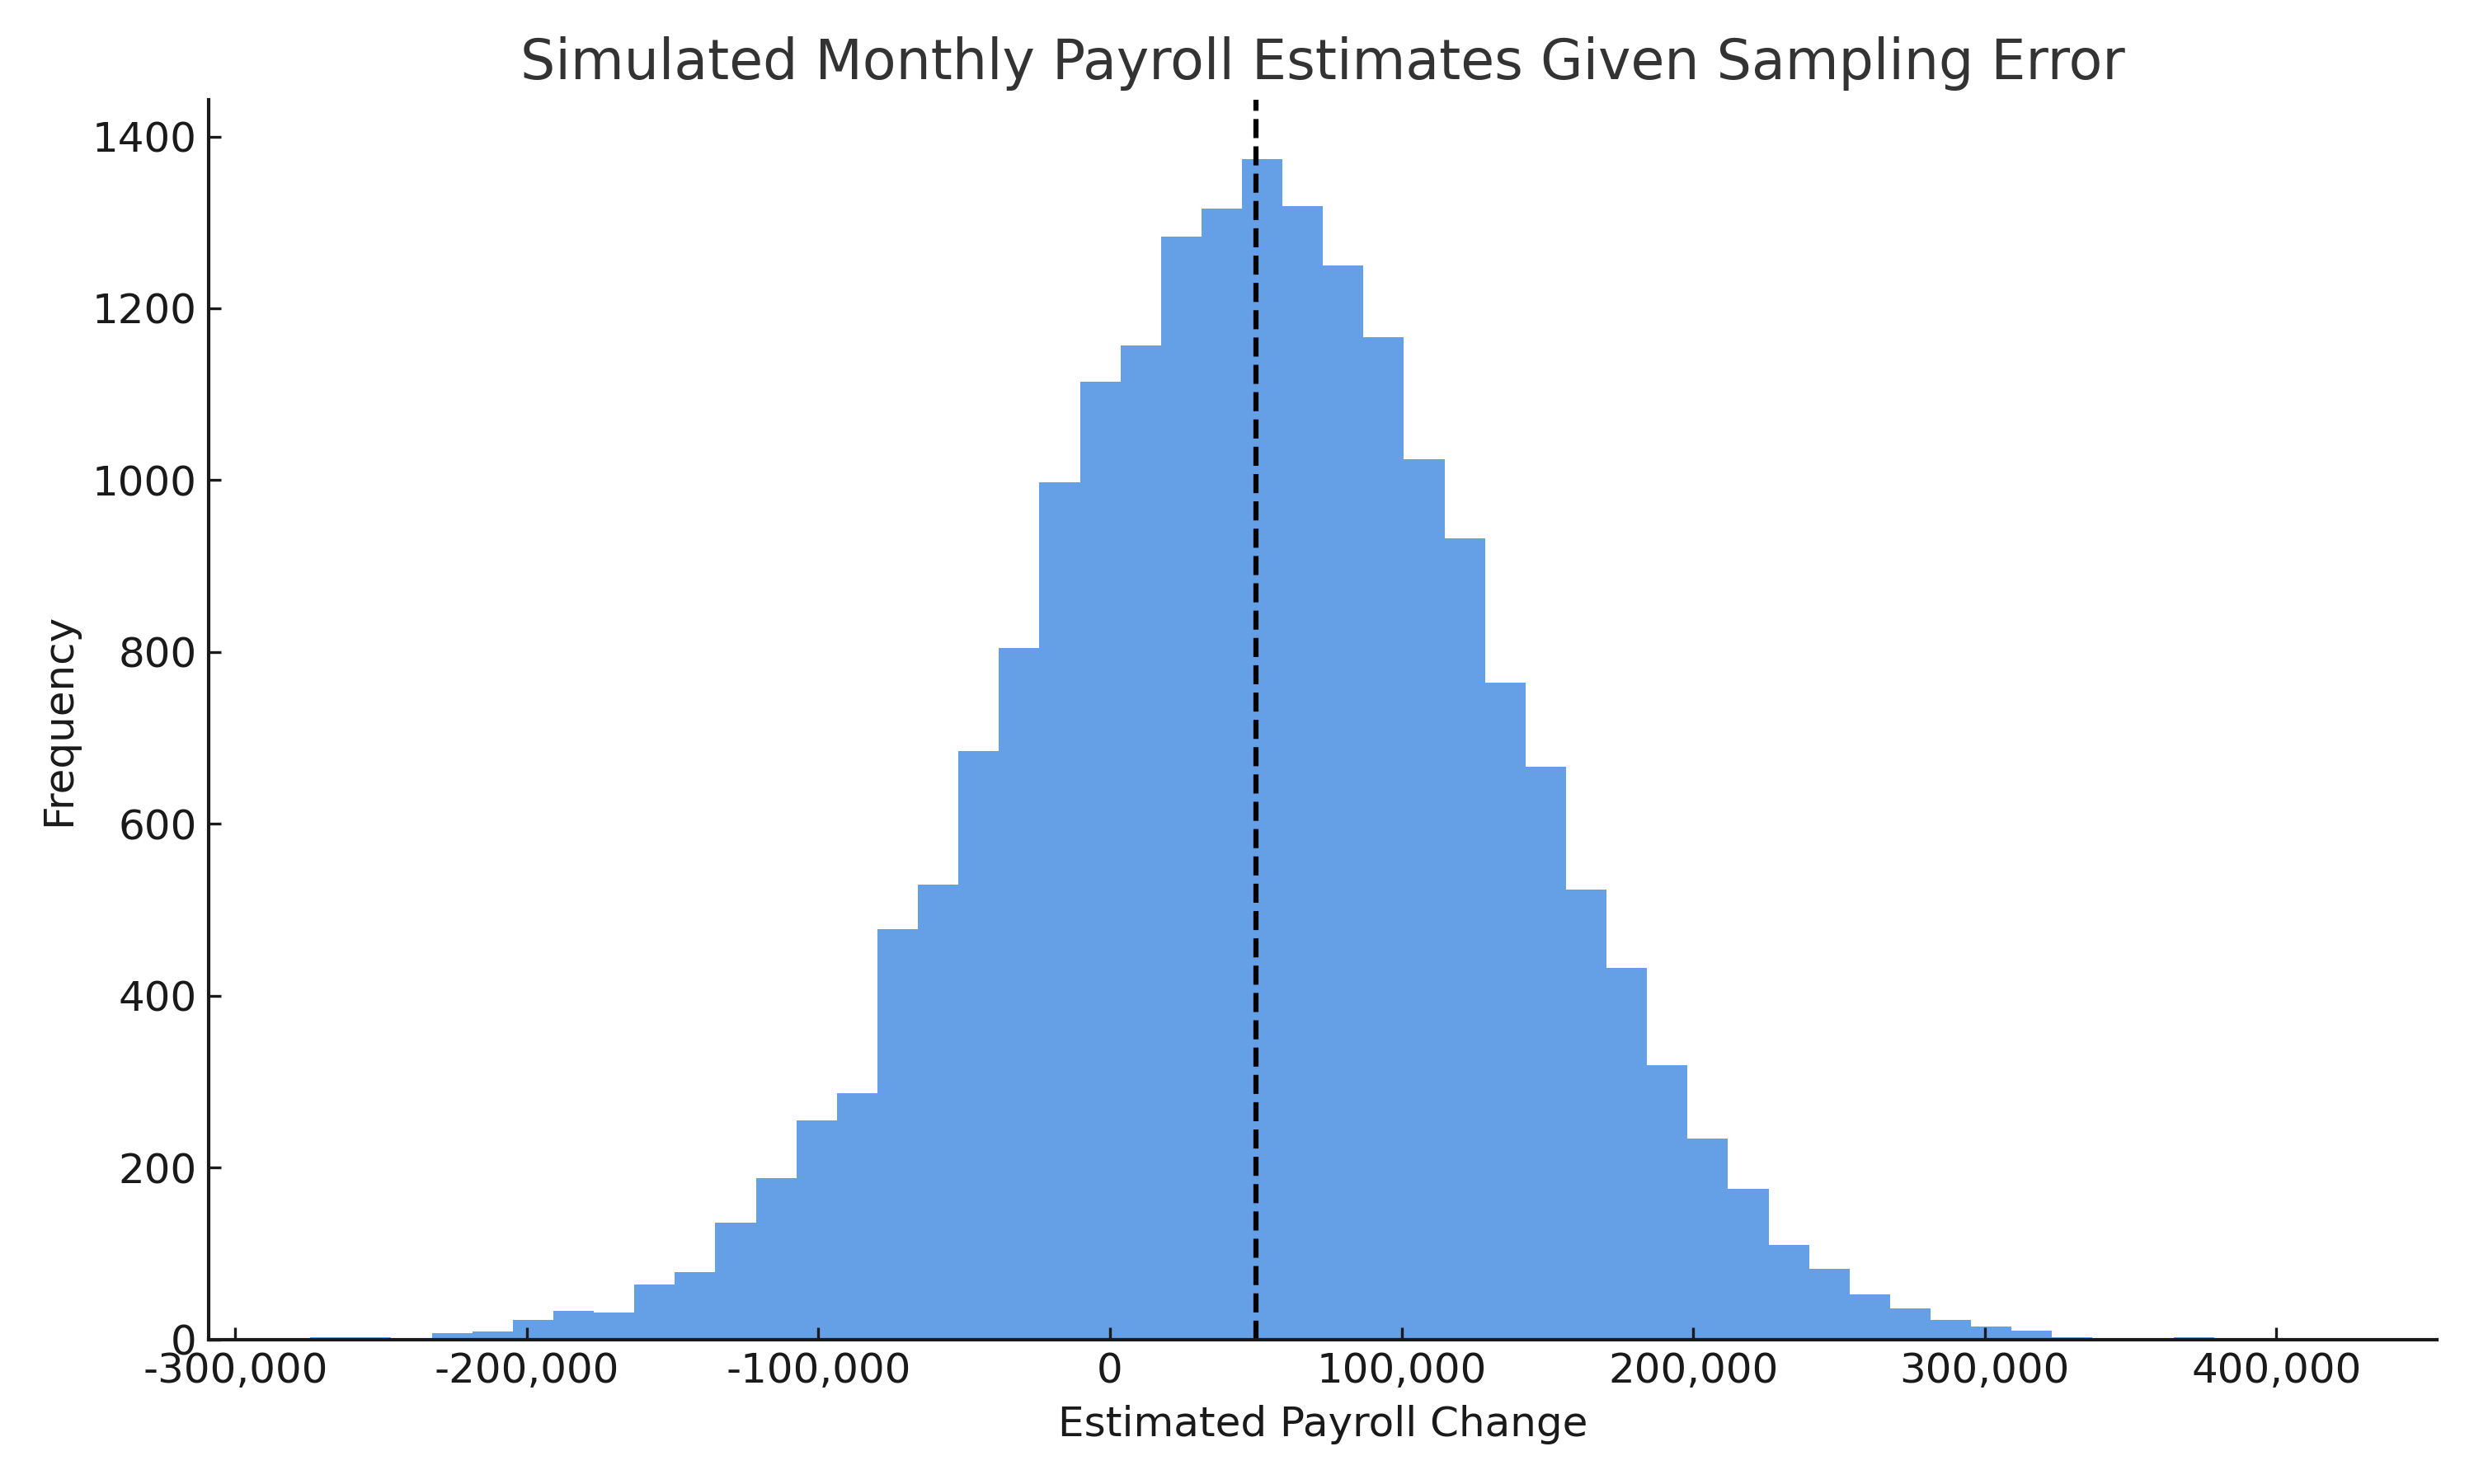
The takeaway is simple: a single month’s payroll print can look strong or weak regardless of the true state of the labor market. This is why relying on a single monthly print can produce a materially misleading picture of labor market conditions.
Why You Should Ignore the Monthly Payroll Print
Two issues make the monthly payroll print a poor real-time gauge of labor market health:
1. The signal-to-noise ratio is extremely low.
Unless the reported change is very positive or very negative (roughly ±166k, or about two standard deviations from zero), we cannot reliably say whether payrolls actually rose or fell during the month.
2. Payroll levels can move for structural reasons.
Payroll growth reflects demographic and population dynamics (e.g., changes in immigration flows), not just cyclical factors. During periods of rapid labor force growth, payroll gains can look strong even when underlying tightness is easing, and vice versa.
Better Real-Time Indicators: The Four Horsemen
As I argued in my Four Horsemen of the Labor Market piece, there are far more useful (and robust) indicators of the health of the labor market:
Job Openings-to-Unemployment Ratio — direct measure of labor demand
Layoff Rate — the probability an employed worker loses a job this month
Job-finding Rate — the share of unemployed workers who become employed this month
Unemployment Rate — the share of the labor force that is unemployed
These are the labor market indicators to focus on. They move early in the cycle, contain far less noise, and provide a clearer real-time signal than monthly payroll prints.
Bottom Line
The monthly payroll print from the BLS is a poor real-time guide to labor market conditions. It is statistically noisy, especially in its first release, and mechanically influenced by population and labor force growth.
In practice, this means the monthly payroll print contains more noise than signal and can mislead more than inform. For these reasons, investors should fade the monthly payroll print and focus instead on more robust indicators of labor market health.
If you enjoyed this mildly efficient and occasionally rational look at why market observers should fade the monthly payroll print from the BLS, consider subscribing below. We’ll keep exploring markets and models, uncovering mildly surprising truths.
No hot takes; just thoughtful ones.

About the Author: Seth Neumuller is an Associate Professor of Economics at Wellesley College where he teaches and conducts research in macroeconomics and finance. He holds a Ph.D. in economics from UCLA. His Substack is Mildly Efficient (and Occasionally Rational) where he explores topics in finance and macro from first principles, cutting through complexity with clear, grounded analysis.
Notes and Sources
AI tools were used to edit prose; all figures are straightforward to reproduce from the cited sources.
Technically, the BLS reports that the 90 percent “confidence interval for the monthly change in total nonfarm employment from the establishment survey is on the order of plus or minus 136,000.” Given that a 90 percent confidence interval corresponds to ±1.6 standard deviations from the estimate, we can conclude that the standard deviation of the monthly payroll prints is roughly 83,000.