
What’s Really Driving the Gold Rally?
The data point to investor demand, not debasement fears or central bank purchases

TL;DR: The recent surge in gold prices is best explained by a sharp rise in investor demand, visible in ETF and bar flows, rather than dollar debasement, de-dollarization, falling real rates, or central bank purchases.
Introduction
Gold prices have surged from about $2,050 per troy ounce in early 2024 to just above $5,000 this month, a gain of more than 140% (Figure 1).
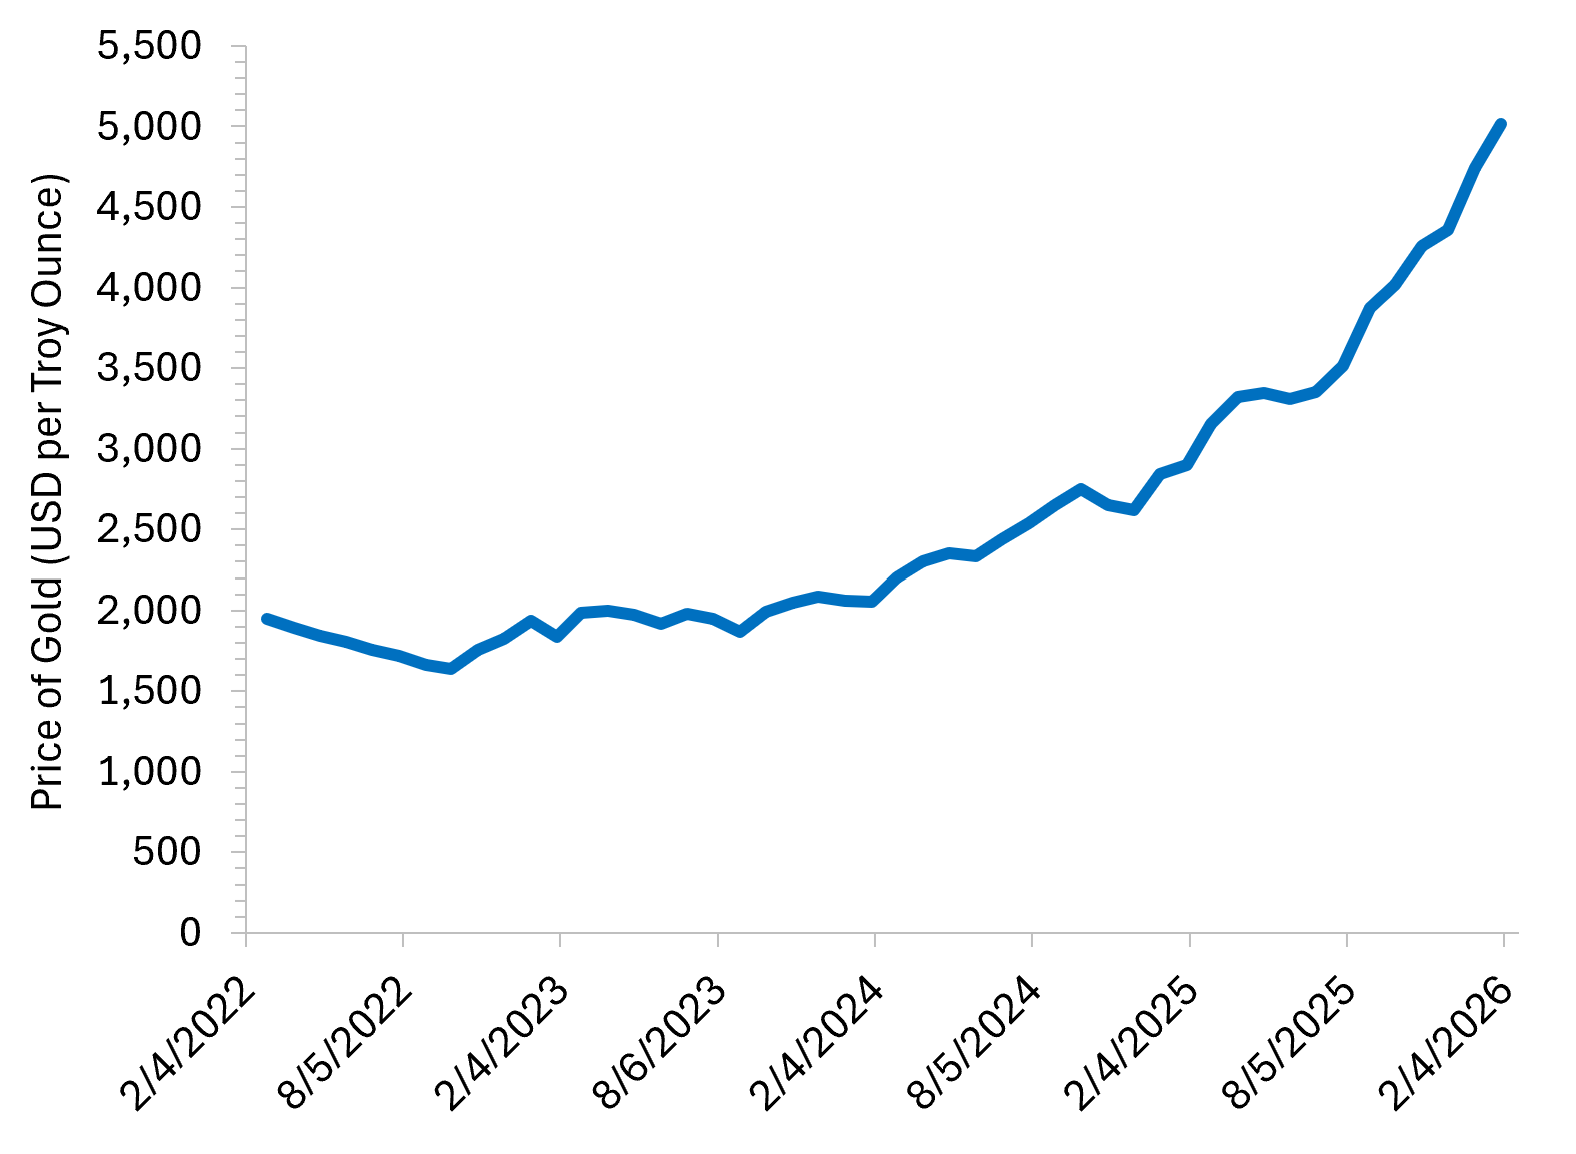
Market observers have offered a range of explanations for this move, from dollar debasement and de-dollarization to falling real rates, central bank buying, and a surge in investor demand.
The goal of this piece is to interrogate the extent to which each of these potential explanations is (or is not) consistent with the facts. What I will argue is that the evidence points squarely to investment flows as the key driver, not dollar debasement, de-dollarization, falling real rates, or central bank purchases.
Let’s examine the facts.
1) Dollar debasement
If gold prices were rising primarily because investors expect a sustained loss of the dollar’s purchasing power, that expectation should appear in market-based inflation expectations.
It does not.
In fact, U.S. Treasury–TIPS breakeven inflation and forward inflation compensation have been remarkably stable over the last three years, remaining rangebound between about 1.8% and 2.7%, even as gold prices accelerated higher (Figure 2).1
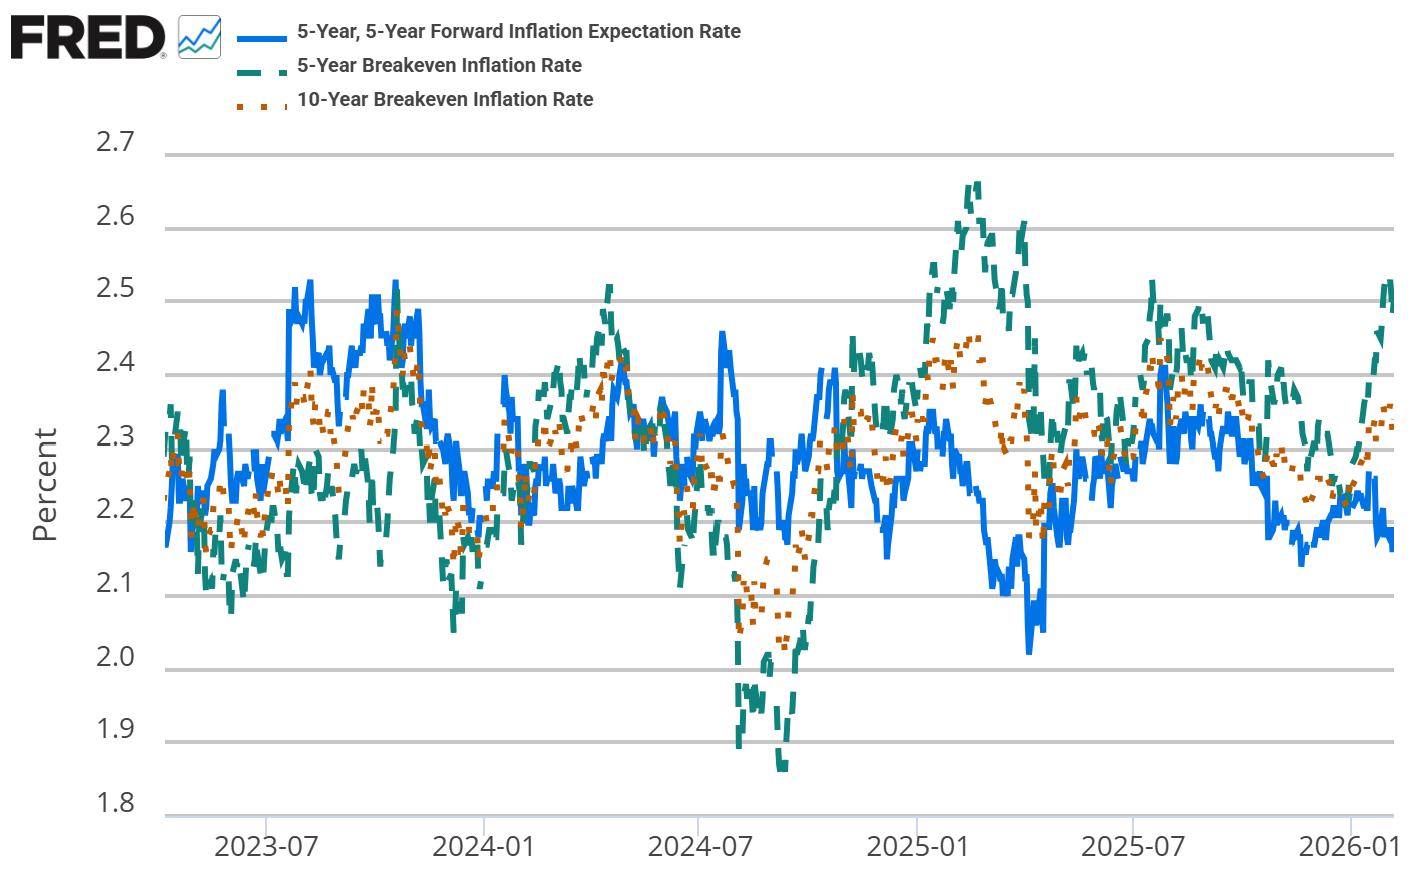
If debasement were the dominant explanation, it would be difficult to reconcile the gold rally with stable inflation expectations. On this metric alone, dollar debasement is unlikely to be a primary driver of the recent surge in the price of gold.
Verdict: Not supported by market-based inflation expectations.
2) De-dollarization
A more defensible explanation is that gold is responding to a weaker dollar, rather than rising inflation expectations.
Because gold is priced in dollars, a weakening dollar mechanically raises the dollar price of gold, even if its real value remains unchanged. More broadly, a weakening dollar can induce portfolio rebalancing away from dollar-denominated assets without implying an imminent loss of reserve-currency status, or de-dollarization.
The question is not whether this channel is plausible, but how much it actually explains.
Figure 3 depicts the U.S. Dollar Index (DXY), a benchmark that measures the value of the U.S. dollar against a basket of six major foreign currencies: the Euro (EUR), Japanese Yen (JPY), British Pound (GBP), Canadian Dollar (CAD), Swedish Krona (SEK), and Swiss Franc (CHF). After a brief period of increased strength in late 2022 as the Federal Reserve hiked the Federal Funds Rate, the U.S. Dollar Index declined by about 14% between late 2022 and early 2026.
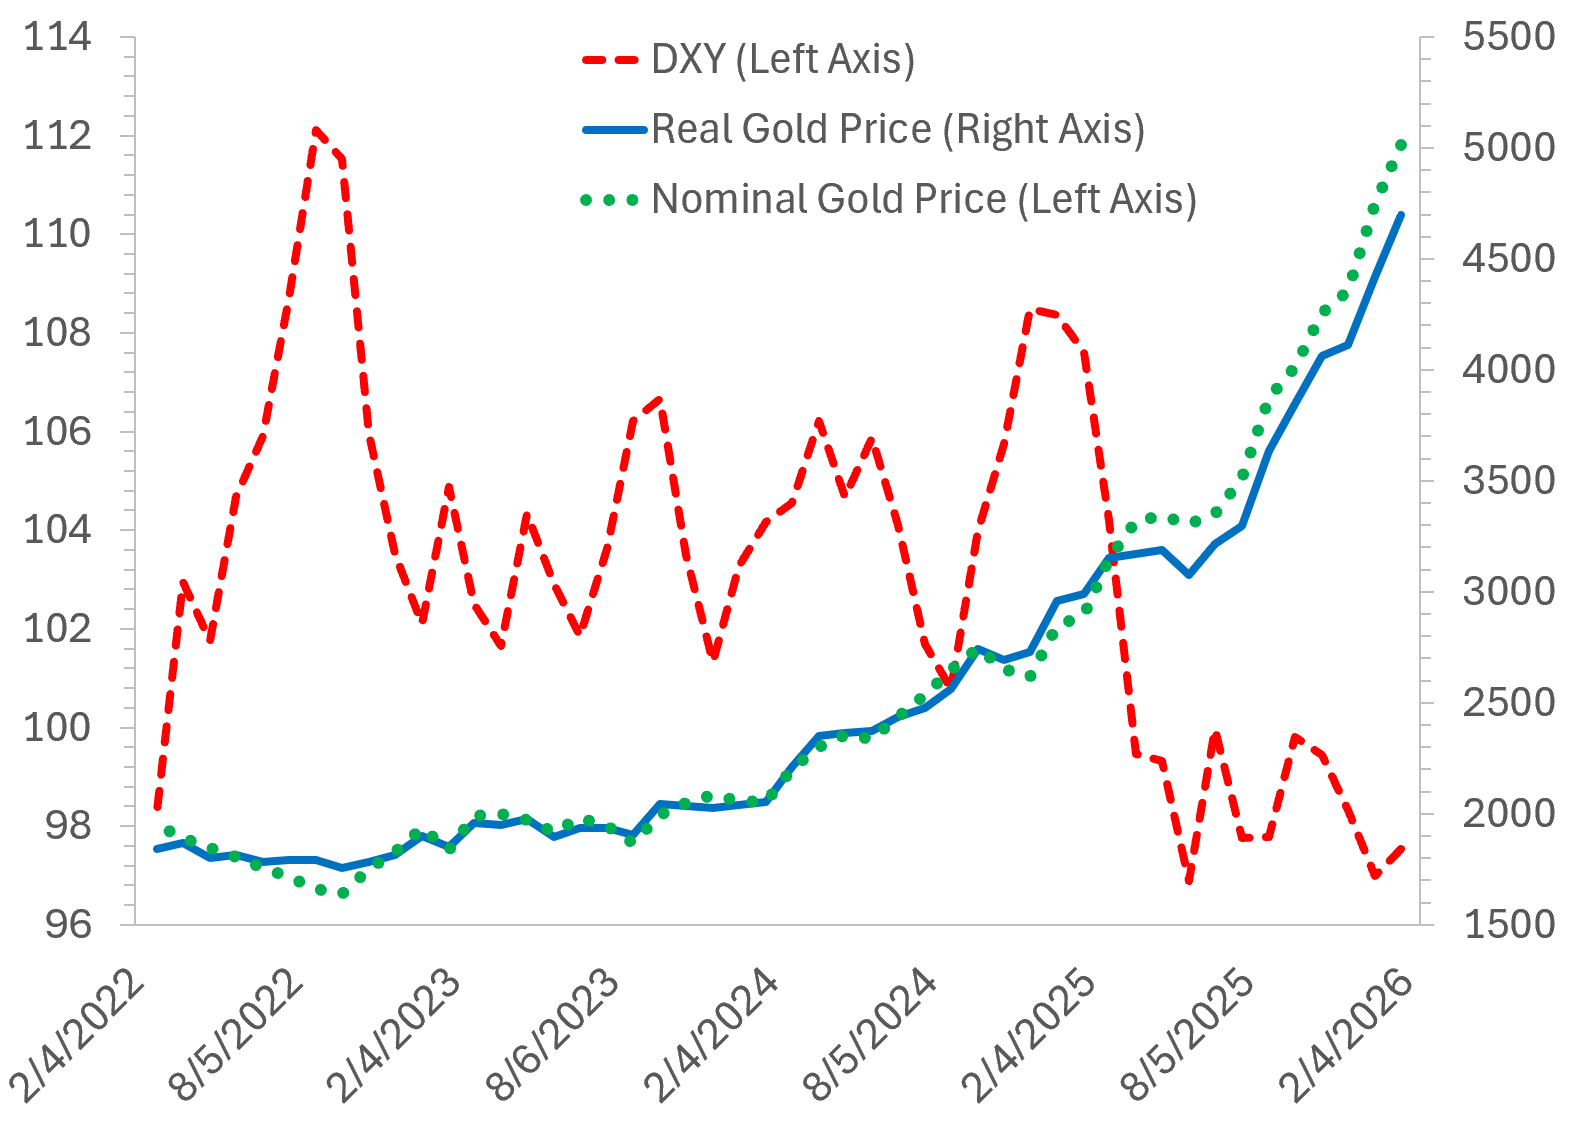
If we zoom in on the most recent two-year period during which the nominal gold price increased by more than 140%, the U.S. Dollar Index declined modestly from roughly 104 to around 97. A simple accounting decomposition shows that only about 7 percent of the rise in the price of gold over this period can be attributed to weakening of the dollar.2 More than 90 percent reflects an increase in the real price of gold.
So while dollar weakening matters, it is quantitatively insufficient to explain the surge in gold prices we have observed over the last two-year period. The rally is not primarily a mechanical FX-driven price effect. Something else must be going on.
One possibility is that expectations of future de-dollarization are influencing gold prices today. We would expect this to show up as increased investor demand (more on this below).
Verdict: Dollar weakening matters, but mechanically it explains only a small slice of the move higher in gold prices.
3) Real interest rates
Gold is often described as sensitive to real interest rates, which determine the opportunity cost of holding a non-yielding asset. Historically, the biggest gold rallies have come when real yields fall sharply, because the opportunity cost of holding gold collapses.
That is not what has happened in this episode.
There has been no sustained decline in real interest rates over the period in which gold prices accelerated. Indeed, since late 2023, 10-year U.S. TIPS yields, a proxy for real yields, have remained range-bound between roughly 1.6% and 2.4% (Figure 4). Real rates therefore do little to explain the timing or magnitude of the rally.
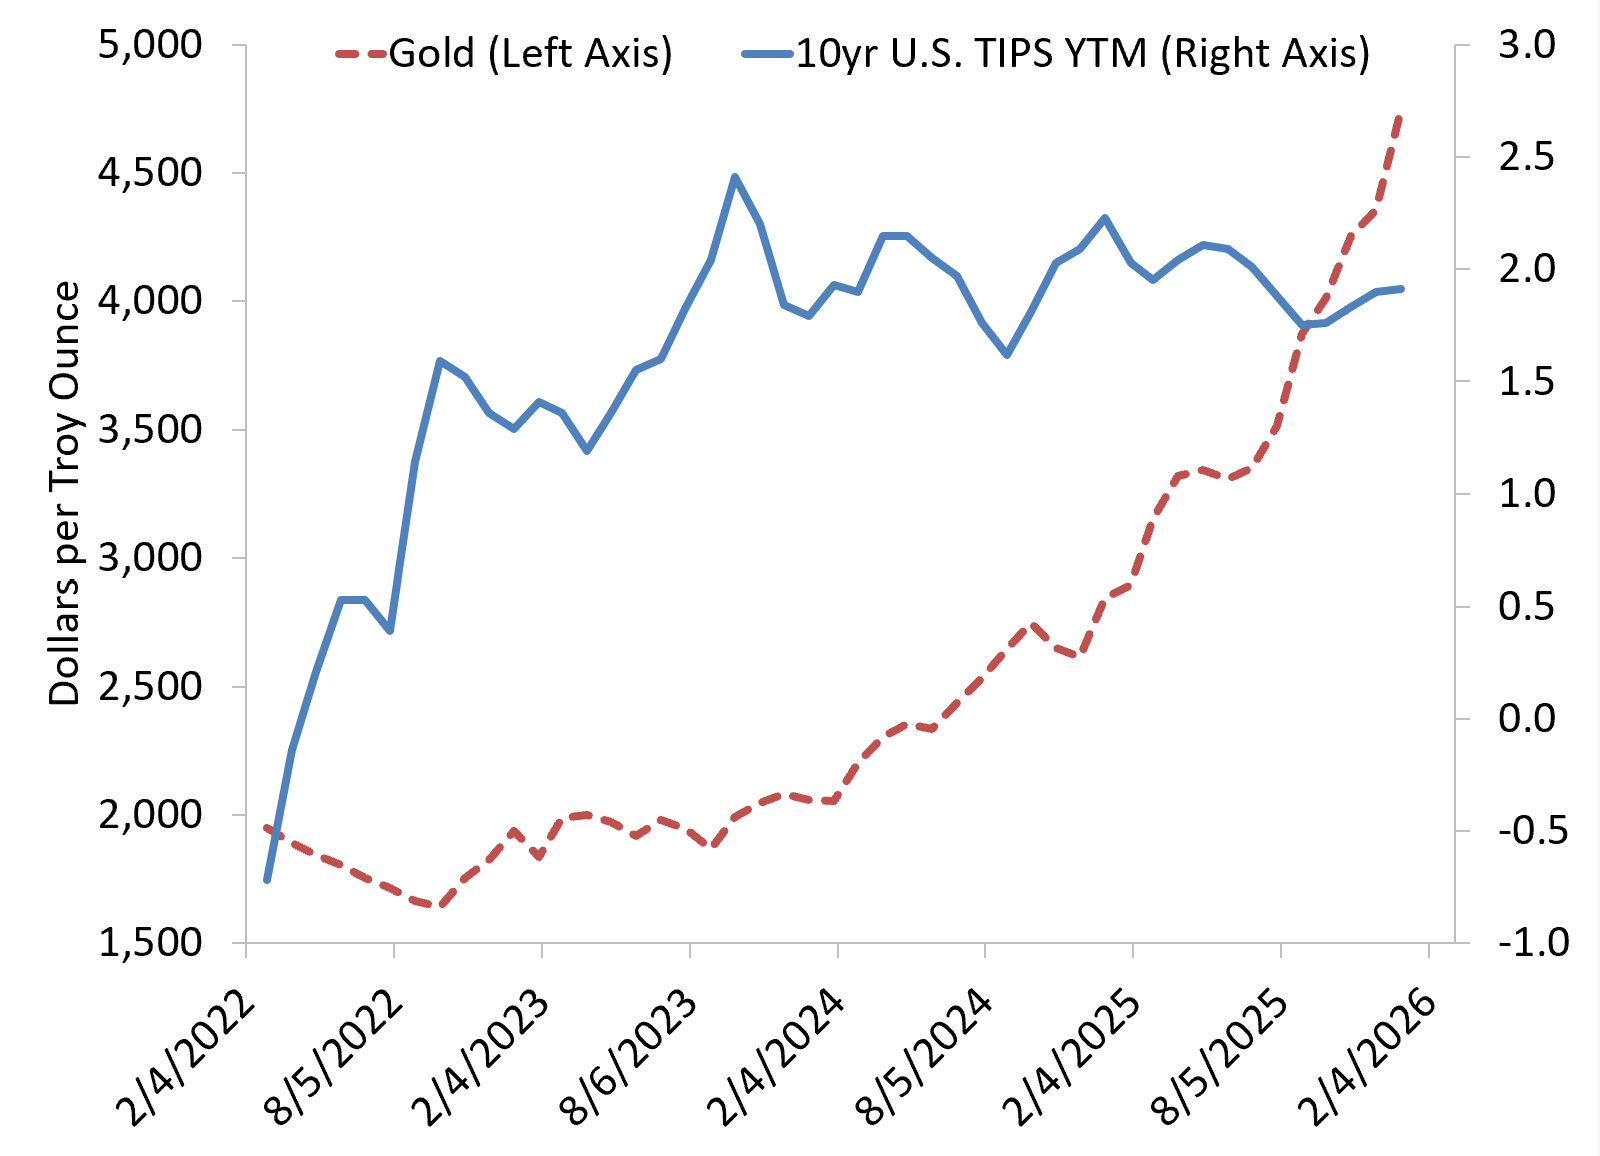
If anything, this episode is unusual precisely because gold has risen sharply in price without a corresponding decline in real yields.
Verdict: Real yields have held steady, making them an unlikely culprit.
4) Central bank buying
Central bank buying is often cited as a key driver of the recent surge in gold prices. Central banks, particularly those in developing countries or in countries which have close ties to Russia or China, fear U.S seizure of their dollar-denominated assets (e.g., U.S. Treasuries), so they have shifted instead to an asset that cannot be easily confiscated by the U.S. government. A shift toward physical gold might also be driven by fear of continued weakening of the U.S. dollar and therefore depreciation of dollar denominated assets like U.S. Treasuries.
Consistent with this story, central banks have indeed been net buyers of physical gold in recent years. But if central bank stockpiling of physical gold were the primary driver of the recent run-up in gold prices, we would have expected to see central bank net purchases accelerate during 2025.
They did not.
In fact, net central bank purchases declined by roughly 20 percent in 2025 compared to 2024, precisely when the rise in gold prices accelerated (Figure 5).3
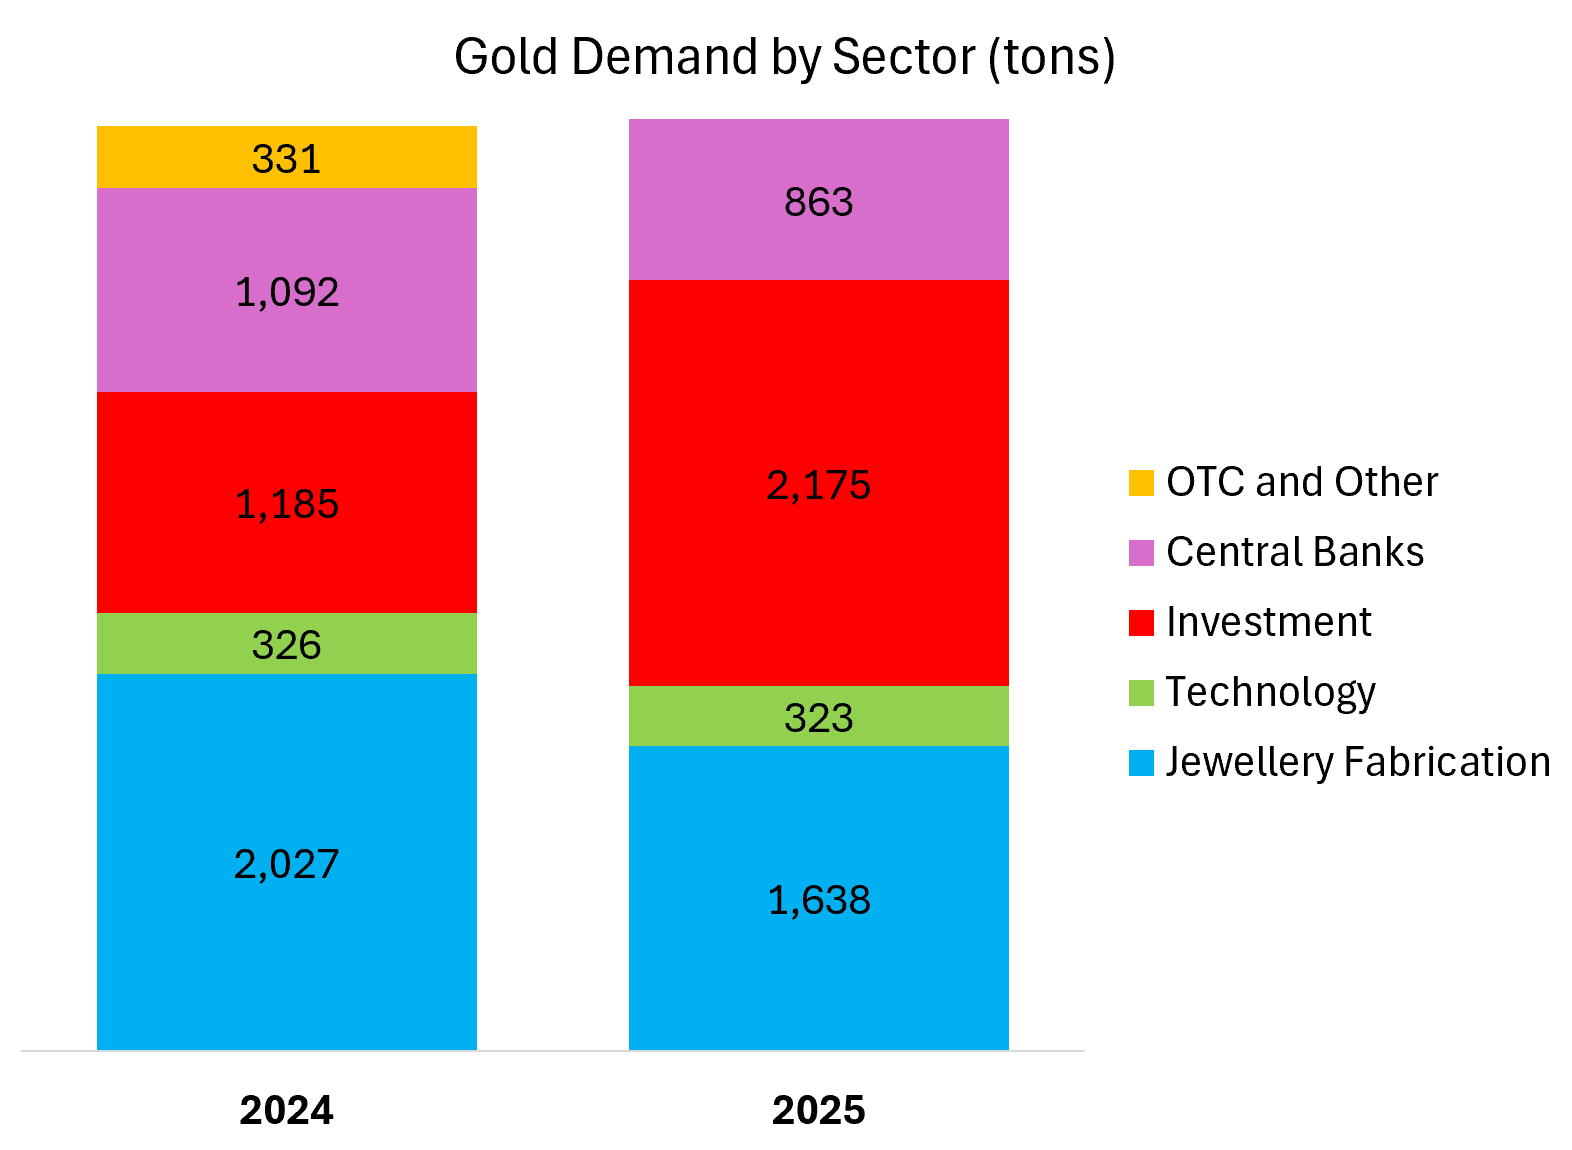
Central banks clearly matter for the long-run level of gold demand, but they are unlikely to be the marginal driver of the recent surge in gold prices.
Verdict: Important in levels, not at the margin in 2025.
5) Investor demand
Figure 5 suggests that, rather than central bank stockpiling, a rapid increase in investor demand is the most plausible driver of the recent surge in gold prices. Between 2024 and 2025, net investment in physical gold increased by nearly 1,000 tons, representing a year-over-year increase of roughly 84%.
Figure 6 breaks down gold demand within the investment sector in both 2024 and 2025. Net investment in gold-backed ETFs increased sharply between 2024 and 2025, from approximately 0 tons of net investment in 2024 to more than 800 tons in 2025.
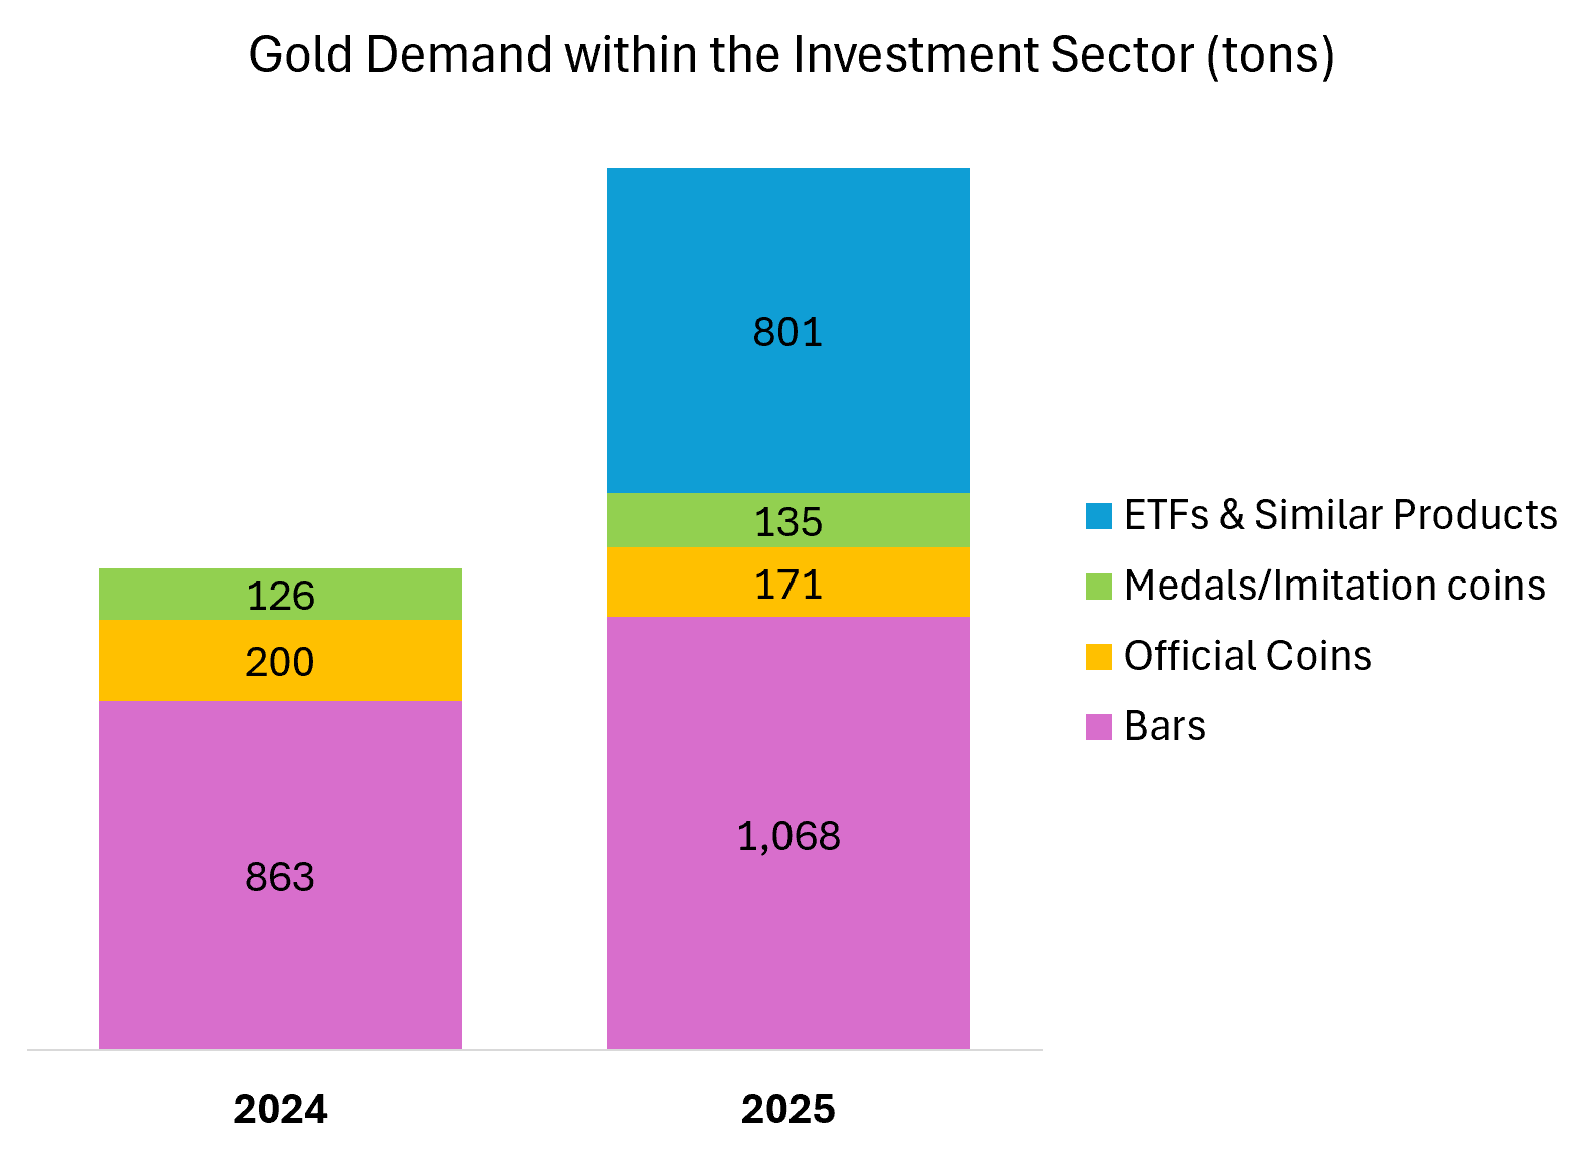
Production of gold was unable to keep up with this rise in net investment. Between 2024 and 2025, net gold production only increased by about 40 tons to roughly 5,000 tons. This means that a full 16% of all gold production last year was absorbed by flows into gold-back ETFs.
Investment in physical gold bars also increased modestly, from about 860 tons in 2024 to roughly 1,070 tons in 2025, meaning that 21% of all gold production last year went to investment in gold bars.
Given relatively stable net gold production, this dramatic rise in investment demand crowded out both central bank purchases and the use of gold for jewelry fabrication.
In liquid markets like this, prices are set at the margin, and ETF flows represent the most flexible and scalable source of marginal demand. It follows that increased investment demand for gold, primarily via ETFs but also through physical gold bars, is the most likely explanation for the recent surge in the price of gold.
Verdict: The only channel that actually moved enough to match the price action.
Conclusion
The recent surge in gold prices does not appear to reflect fears of imminent dollar debasement. Market-based inflation expectations remain well anchored, and real interest rates have been broadly stable throughout the period in which gold prices accelerated higher.
Nor is the rally primarily an exchange-rate story. Since February 2024, only about 7 percent of the increase in gold prices can be mechanically attributed to dollar depreciation. Central bank purchases, meanwhile, slowed in 2025 as gold prices continued to rise, making them unlikely to be the marginal driver of the move.
Taken together, these facts leave little room for macro-driven explanations. Gold is not responding to rising inflation expectations, falling real yields, or an abrupt breakdown in the dollar as the world’s reserve currency.
What the data do point to instead is a pronounced increase in investor demand, visible most clearly in flows into gold-backed ETFs and, to a lesser extent, physical gold bars. Put simply, ETFs and bar demand were large enough, and flexible enough, to absorb a big share of global supply, and prices adjusted accordingly.
What remains difficult to pin down is why investor demand has risen so sharply. The data do not allow us to cleanly distinguish between several overlapping motivations: hedging against the possibility of future de-dollarization, insuring against broader geopolitical or financial risks, or more purely speculative behavior, including momentum and trend-following strategies. All of these channels would manifest in similar ways—through increased investment flows—making them observationally hard to separate.
If you enjoyed this mildly efficient and occasionally rational take on the recent surge in the price of gold, consider subscribing below. We’ll keep exploring markets and models, uncovering mildly surprising truths along the way.
No hot takes; just thoughtful ones.

About the Author: Seth Neumuller is an Associate Professor of Economics at Wellesley College where he teaches and conducts research in macroeconomics and finance. He holds a Ph.D. in economics from UCLA. His Substack is Mildly Efficient (and Occasionally Rational) where he explores topics in finance and macro from first principles, cutting through complexity with clear, grounded analysis.
Notes and Sources
AI tools were used to edit prose; all figures are straightforward to reproduce from the cited sources.
Breakevens aren’t a pure read of inflation expectations, but large, persistent changes in expected inflation still tend to show up in these measures
Because gold is priced in dollars, its dollar price can be written as

Taking log differences between February 2024 and February 2026 yields

The fraction of the gold price increase mechanically attributable to dollar depreciation is therefore
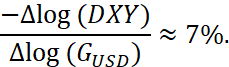
The remainder reflects an increase in the real price of gold rather than weakening of the dollar.
Demand for gold by the technology sector accounts for less than 7% of total gold production, and this amount was largely unchanged between 2024 and 2025 despite the rapid increase in AI infrastructure investment (Figure 5).